
I mean solve for me I want to compete it and send it to school
ScanSolve AI Answer
Step-by-step solution
4 stepsThis project requires you to track your personal financial transactions for one week, analyze the data, and then present your findings. Here's how you can complete it:
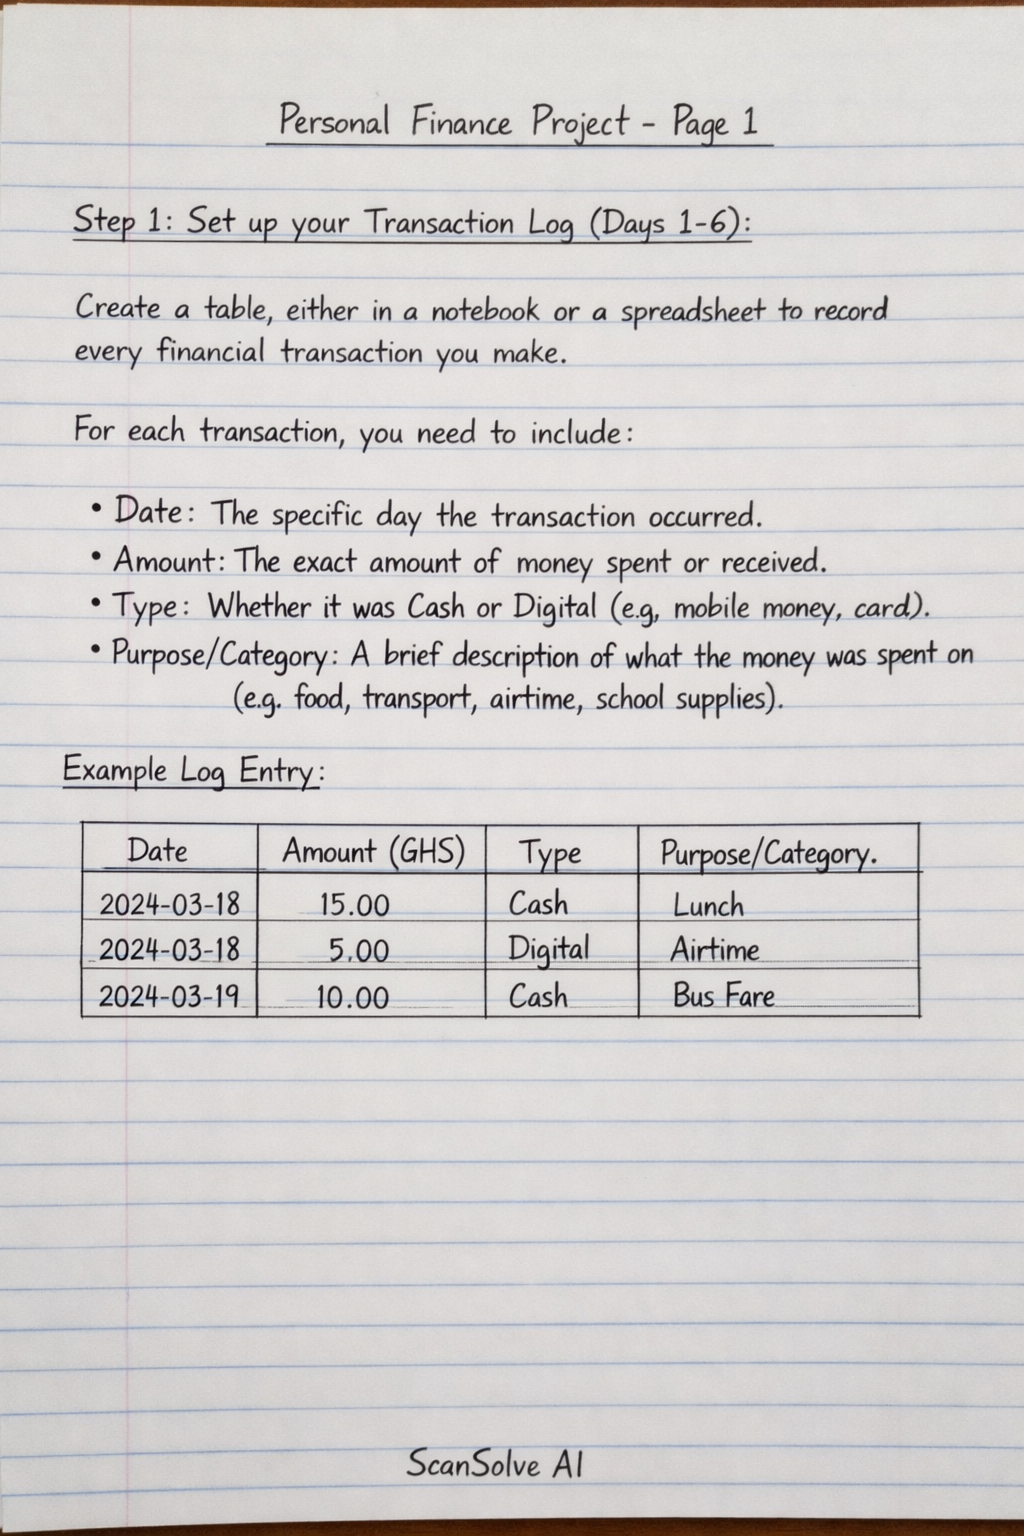
Set up your Transaction Log (Days 1-6).
Create a table, either in a notebook or a spreadsheet (like Excel or Google Sheets), to record every financial transaction you make. For each transaction, you need to include:
- Date: The specific day the transaction occurred.
- Amount: The exact amount of money spent or received.
- Type: Whether it was a cash transaction or a digital transaction (e.g., mobile money, card payment).
- Purpose/Category: A brief description of what the money was spent on (e.g., food, transport, airtime, entertainment, school supplies).
Example Log Entry:
Date Amount (GHS) Type Purpose/Category 2024-03-18 15.00 Cash Lunch 2024-03-18 5.00 Digital Airtime 2024-03-19 10.00 Cash Bus Fare Analyze Your Data (Day 7).
After recording all transactions for six days, transfer your data into a spreadsheet if you haven't already. Then, perform the following analysis:
- Categorize Spending: Group your transactions into broader categories (e.g., Food, Transportation, Education, Personal Care, Entertainment).
- Calculate Totals:
- Total spending for each category.
- Total cash spending for the week.
- Total digital spending for the week.
- Total spending for each day.
- Create Graphs:
- Pie Chart: Show the proportion of your total spending for each category. For example, if you spent GHS 100 total and GHS 40 on food, food would be 40% of the pie.
- Bar Graph: Compare your total cash spending versus your total digital spending for the week.
- Line Graph: Illustrate your daily spending trends over the six days. The x-axis would be the days, and the y-axis would be the total spending for that day.
Write Your Summary Report (Day 7).
Based on your analysis and graphs, write a report that includes:
- Introduction: Briefly state the purpose of the project.
- Methodology: Explain how you tracked your transactions (e.g., "I used a spreadsheet to record all cash and digital transactions for six days, categorizing them by purpose.").
- Key Findings: Discuss what your graphs reveal. For example:
- "My largest spending category was food, accounting for 45% of my total expenses."
- "I spent significantly more using cash (GHS 70) than digital payments (GHS 30)."
- "My spending was highest on Monday (GHS 25) and lowest on Wednesday (GHS 10)."
- Insights and Reflections: What did you learn about your spending habits? Were there any surprises?
- Recommendations: Suggest ways you could improve your financial planning or spending habits based on your findings. For example, "To save money, I could pack lunch twice a week instead of buying it."
- Conclusion: Summarize the main takeaway from your project.
Prepare for Presentation (Day 7).
Organize your graphs and summary report for presentation to your class. Ensure your graphs are clearly labeled and easy to understand.
The final output for your school will be your transaction log, the graphs you created, and your summary report.
Still stuck on this one?
Ask a follow-up, and the answer starts from this question.
More Mathematics Questions
Handwritten Step-by-Step Solution
Get this as a handwritten image on WhatsApp — like a tutor wrote it for you.
Try on WhatsApp