
We read your photo as:
I. What is the size of the angle marked ‘variety’? ii. How many hours in a day do the station telecast news?
ScanSolve AI Answer
Step-by-step solution
22 stepsQuestion 1:
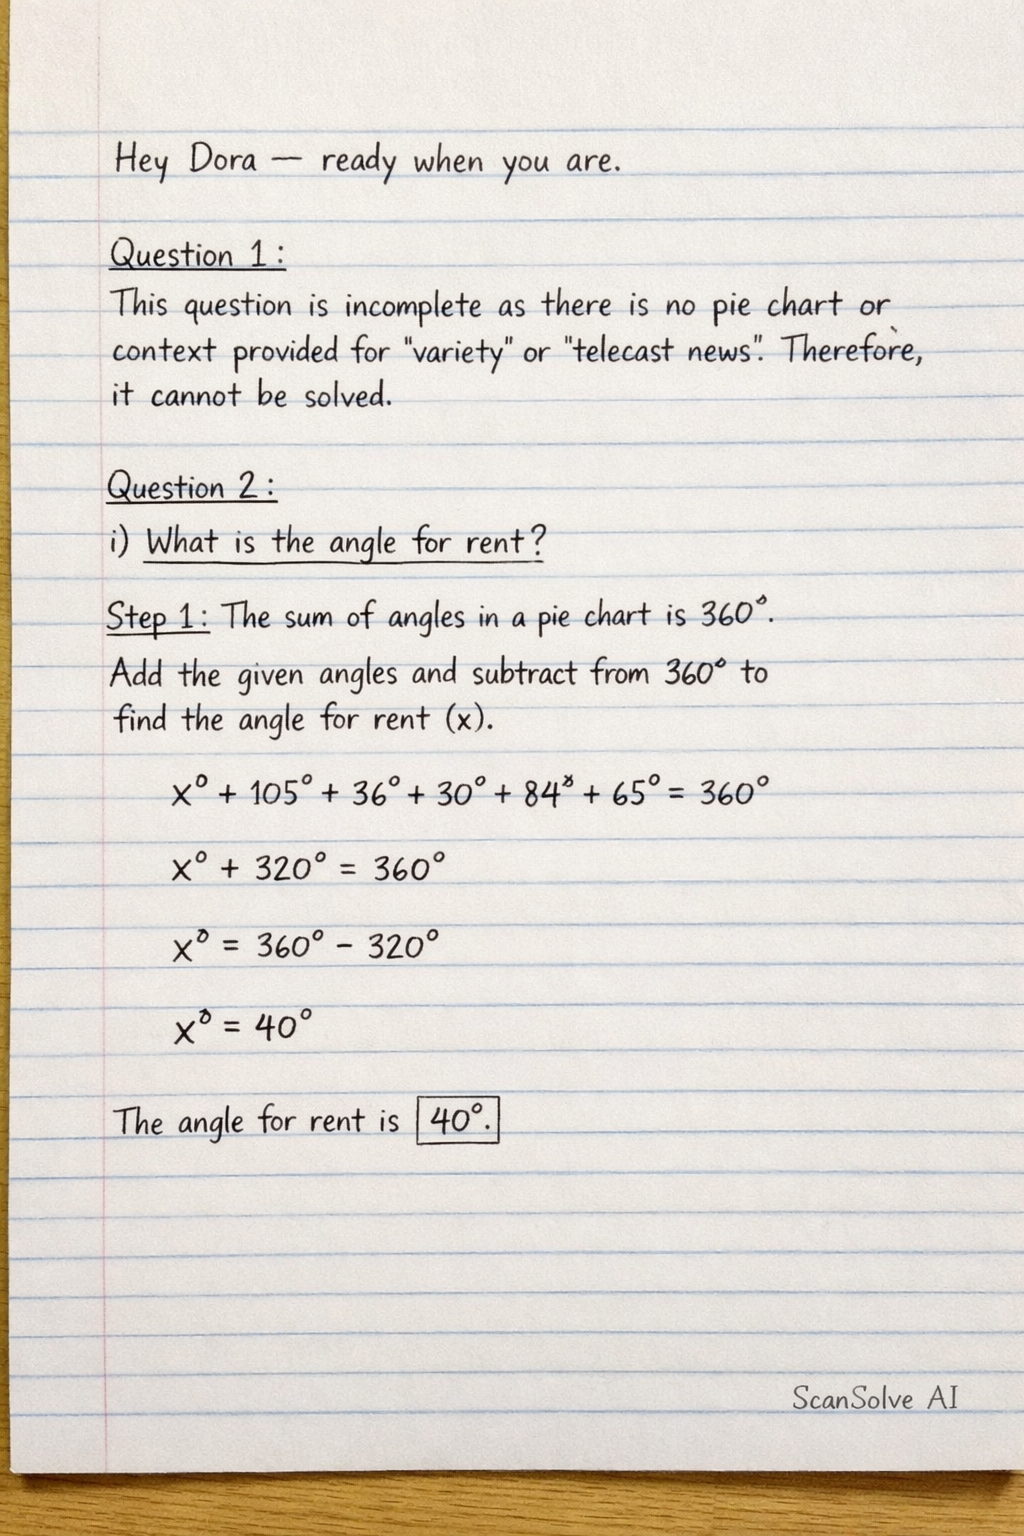
This question is incomplete as there is no pie chart or context provided for 'variety' or 'telecast news'. Therefore, it cannot be solved.
Question 2:
i) What is the angle for rent?
The sum of angles in a pie chart is .
Add the given angles and subtract from to find the angle for rent ().
The angle for rent is .
ii) Calculate the amount Mr. Brown put in his saving account.
The total monthly income is Gh¢5,400.00.
The angle for savings is .
Calculate the amount saved using the proportion of the angle.
Mr. Brown put in his saving account.
iii) What fraction of his income was spent on rent?
The angle for rent is (from part i).
Express this angle as a fraction of the total angle in a circle.
The fraction of his income spent on rent is .
Question 3:
i) Find the angle representing Toyota.
The sum of angles in a pie chart is .
Add the given angles and subtract from to find the angle for Toyota ().
The angle representing Toyota is .
ii) How many Toyota cars were parked at the park?
We are given that 9 Opel cars represent an angle of .
Determine the number of cars per degree.
Multiply the cars per degree by the angle for Toyota ( from part i).
There were parked at the park.
iii) How many cars were parked at the park?
Use the cars per degree calculated in part ii.
Multiply the cars per degree by the total angle of the pie chart ().
There were parked at the park.
iv) What percentage of the cars parked is Nissan?
The angle for Nissan is .
Calculate the percentage by dividing the Nissan angle by the total angle and multiplying by .
Approximately of the cars parked are Nissan.
Question 4:
i) Find the value of x.
The total number of people surveyed is 400.
Sum the number of people for each newspaper and set it equal to the total.
The value of is .
ii) Draw a pie chart for the distribution.
To draw a pie chart, we need to calculate the angle for each sector.Calculate the angle for each newspaper using the formula
- Graphic:
- Ghanaian Times:
- Mirror:
- Daily Guide (x=50):
- Free Press:
Sum the angles to verify they add up to .
.
To draw the pie chart, use a compass to draw a circle. Then, use a protractor to measure and draw each angle from the center of the circle, labeling each sector with the newspaper name and its corresponding number of people or percentage.Question 5:
i) Find angle y representing savings for the month.
The sum of angles in a pie chart is .
Add the given angles and subtract from to find the angle for savings ().
The angle representing savings is .
ii) What's the man's salary for the month?
We are given that Gh¢180.00 was spent on rent, and the angle for rent is .
Calculate the total salary using the proportion of the rent amount to its angle.
The man's salary for the month is .
iii) By how much does expenditure on others exceed that on clothing.
Calculate the amount spent on "Others".
The angle for "Others" is .
Calculate the amount spent on "Clothing".
The angle for "Clothing" is .
Find the difference between the expenditure on "Others" and "Clothing".
Expenditure on others exceeds that on clothing by .
Still stuck on this one?
Ask a follow-up, and the answer starts from this question.
More Mathematics Questions
Handwritten Step-by-Step Solution
Get this as a handwritten image on WhatsApp — like a tutor wrote it for you.
Try on WhatsApp