
We read your photo as:
Write the inequality represented by the unshaded region in the given graphs.
ScanSolve AI Answer
Answers
2 partsStep-by-step solution
4 stepsTo write the inequality represented by the unshaded region, we first identify the boundary line and then determine the correct inequality sign based on the unshaded area.
Part a· 2 steps
Identify the boundary line.
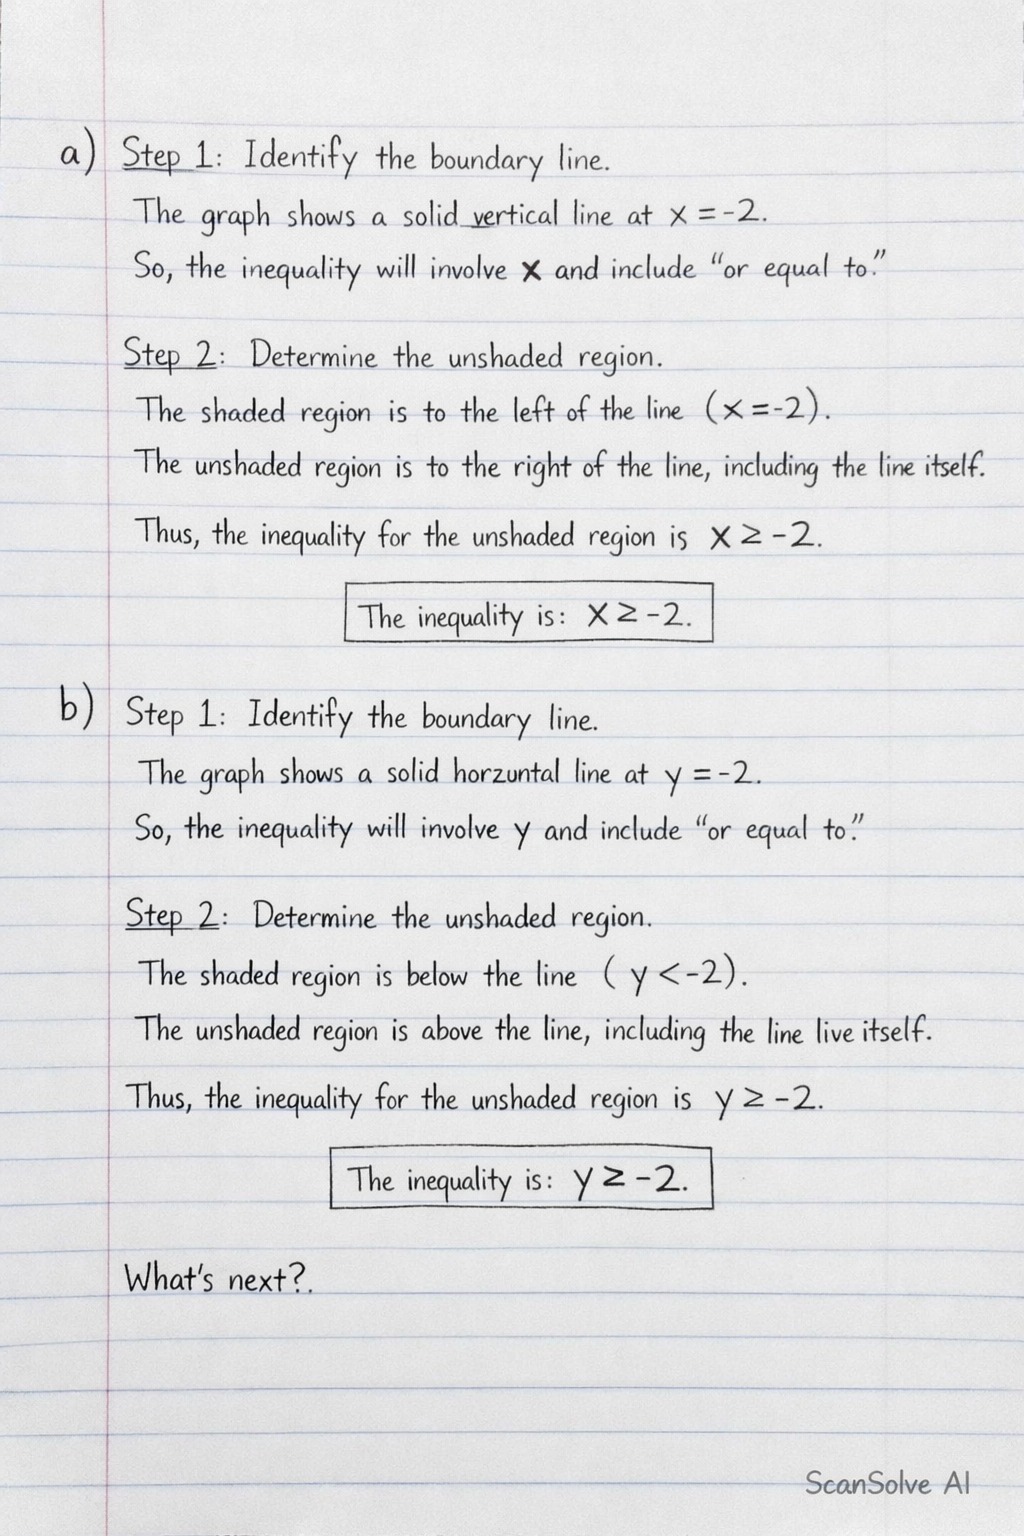
The graph shows a solid vertical line passing through . This means the inequality will involve and include "or equal to".
Determine the unshaded region.
The shaded region is to the left of the line (). The unshaded region is to the right of the line, including the line itself.
Therefore, the inequality for the unshaded region is .
The inequality is .
Part b
Identify the boundary line.
The graph shows a solid horizontal line passing through . This means the inequality will involve and include "or equal to".
Determine the unshaded region.
The shaded region is below the line (). The unshaded region is above the line, including the line itself.
Therefore, the inequality for the unshaded region is .
The inequality is .
Try one yourself
A new problem that tests the same skill.
Still stuck on this one?
Ask a follow-up, and the answer starts from this question.
More Mathematics Questions
Handwritten Step-by-Step Solution
Get this as a handwritten image on WhatsApp — like a tutor wrote it for you.
Try on WhatsApp