
We read your photo as:
From the following figure, write down the inequalities which describe the shaded regions.
ScanSolve AI Answer
Step-by-step solution
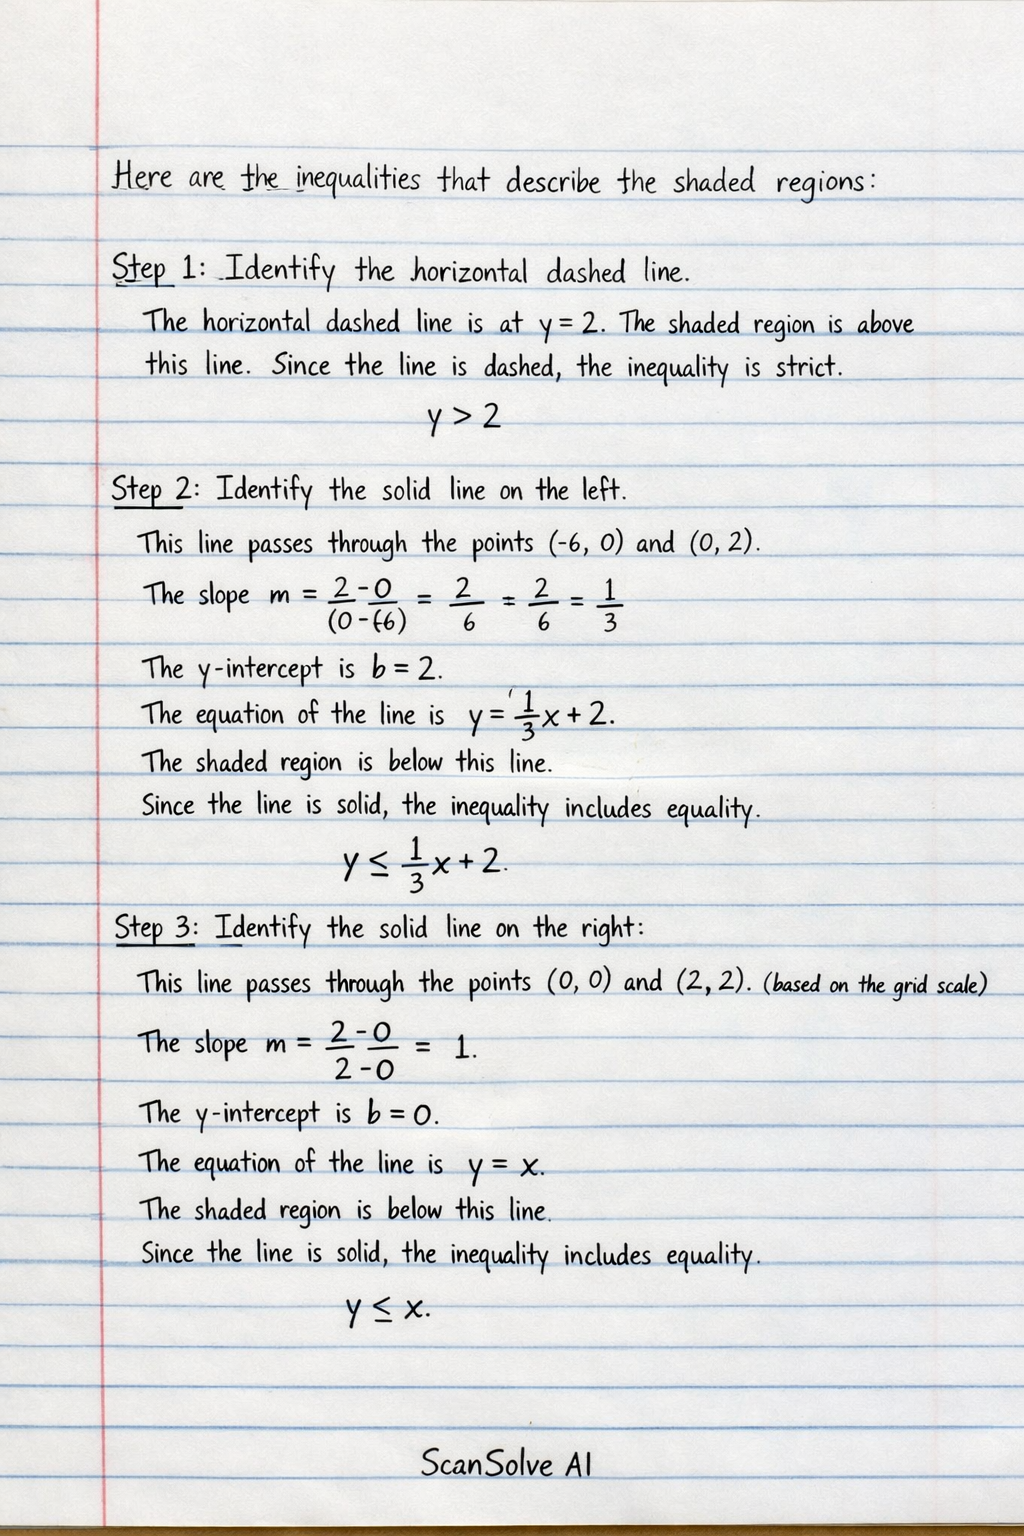
4 stepsHere are the inequalities that describe the shaded regions:
Identify the horizontal dashed line.
The horizontal dashed line is at . The shaded region is above this line. Since the line is dashed, the inequality is strict.
Identify the solid line on the left.
This line passes through the points and .
The slope .
The y-intercept is .
The equation of the line is .
The shaded region is below this line. Since the line is solid, the inequality includes equality.Identify the solid line on the right.
This line passes through the points and (based on the grid scale).
The slope .
The y-intercept is .
The equation of the line is .
The shaded region is below this line. Since the line is solid, the inequality includes equality.Identify the vertical line (y-axis).
The y-axis is the line . The shaded region is to the left of this line. Since it's a solid line, the inequality includes equality.
The inequalities describing the shaded regions are:
Still stuck on this one?
Ask a follow-up, and the answer starts from this question.
More Mathematics Questions
Handwritten Step-by-Step Solution
Get this as a handwritten image on WhatsApp — like a tutor wrote it for you.
Try on WhatsApp