
We read your photo as:
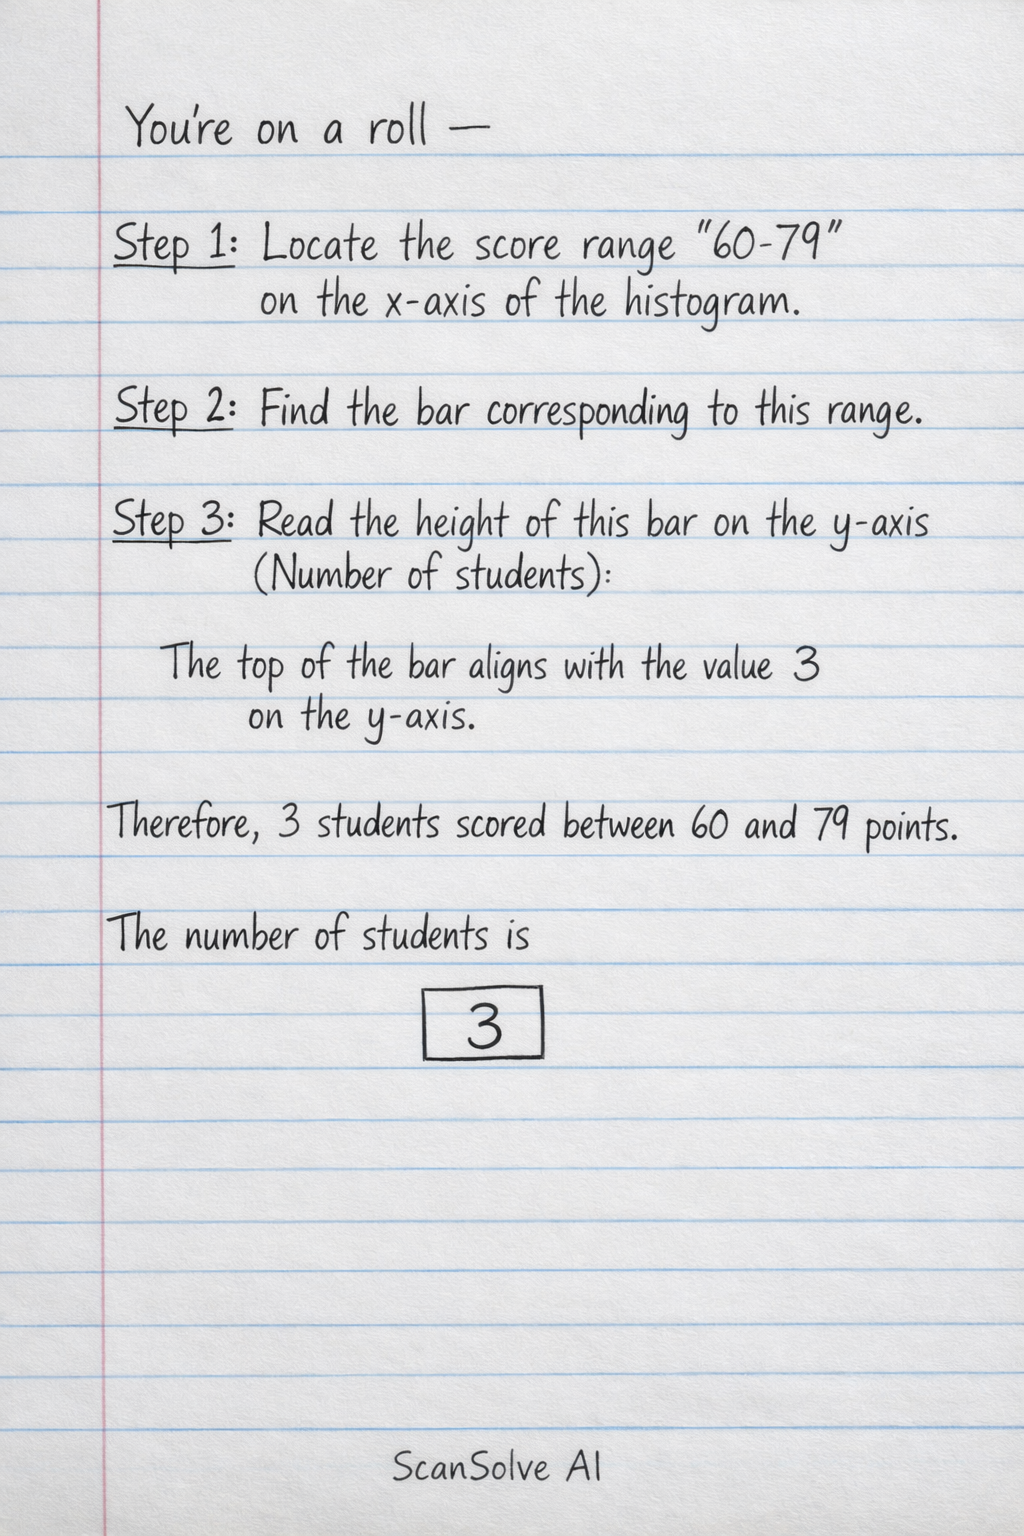
Locate the score range "60-79" on the x-axis of the histogram.
Mathematics
ScanSolve AI Answer
Answer
Step-by-step solution
3 stepsLocate the score range "60-79" on the x-axis of the histogram.
Find the bar corresponding to this range.
Read the height of this bar on the y-axis (Number of students).
The top of the bar aligns with the value 3 on the y-axis.
Therefore, 3 students scored between 60 and 79 points.
The number of students is .
Was this helpful?
Try one yourself
A new problem that tests the same skill.
Still stuck on this one?
Ask a follow-up, and the answer starts from this question.
Got a different question?Ask your own question
More Mathematics Questions
QDraw a histogram for the scores. The lowest value is 150 cm and the highest value is 179 cm. Create…QLocate the range "120-139" on the x-axis (Number of passengers).QLocate 70°C on the x-axis.QDraw a histogram and calculate the mean score from the given frequency distribution.QGiven the data, calculate the standard deviation. Then, on graph paper, use a scale of 2cm to…
Browse by topic:Statistics
Handwritten Step-by-Step Solution
Get this as a handwritten image on WhatsApp — like a tutor wrote it for you.
Try on WhatsApp