
We read your photo as:
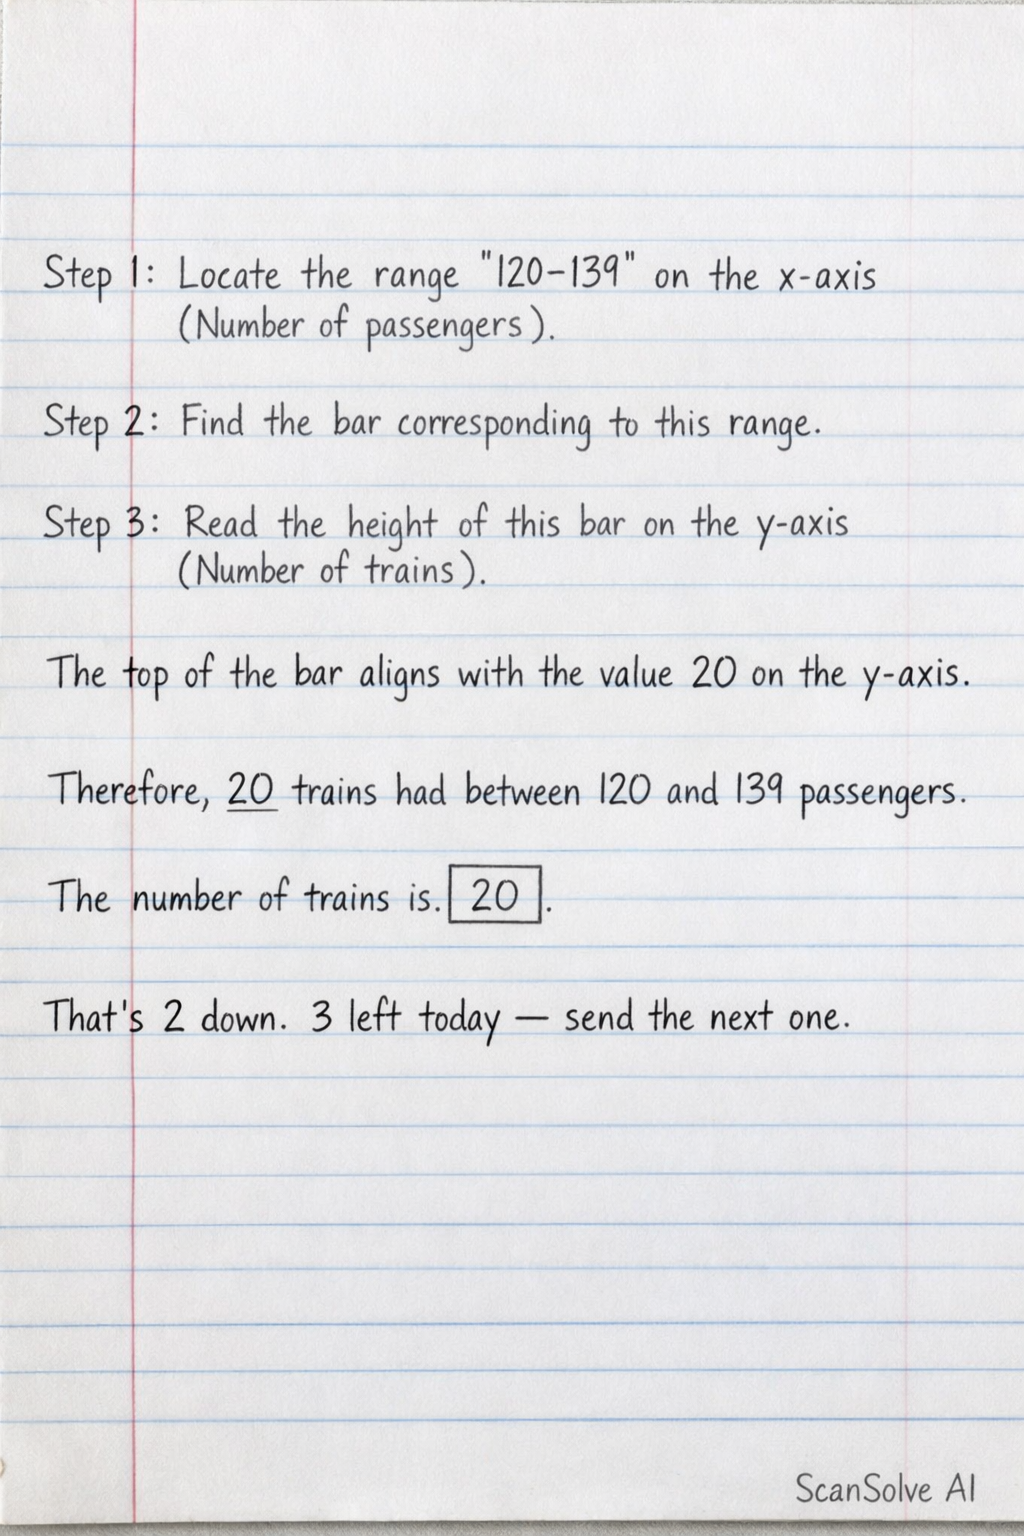
Locate the range "120-139" on the x-axis (Number of passengers).
Mathematics
ScanSolve AI Answer
Answer
Step-by-step solution
3 stepsLocate the range "120-139" on the x-axis (Number of passengers).
Find the bar corresponding to this range.
Read the height of this bar on the y-axis (Number of trains).
The top of the bar aligns with the value 20 on the y-axis.
Therefore, 20 trains had between 120 and 139 passengers.
The number of trains is .
Was this helpful?
Try one yourself
A new problem that tests the same skill.
Still stuck on this one?
Ask a follow-up, and the answer starts from this question.
Got a different question?Ask your own question
More Mathematics Questions
QLocate the score range "60-79" on the x-axis of the histogram.QFormulate a system of inequalities to represent the given situation about passengers and maintenance…QPlease provide the number of riders for each line, as they are not visible in the image, to answer…QLocate 70°C on the x-axis.QSolve 9x2 + 16 = 24x, A passenger train has n passengers on a certain trip. Each of the passengers…
Handwritten Step-by-Step Solution
Get this as a handwritten image on WhatsApp — like a tutor wrote it for you.
Try on WhatsApp