
We read your photo as:
Use the table in 3.2 to draw a graph showing the relationship between the number of hours travelled (x) and the cost of the trip (y) on the grid provided.
ScanSolve AI Answer
Use the left and right arrow keys to trace the curve, up and down to jump between key points, and plus and minus to zoom.
| Point | x | y |
|---|---|---|
| x-intercept | −1.67 | 0 |
| y-intercept | 0 | 50 |
Step-by-step solution
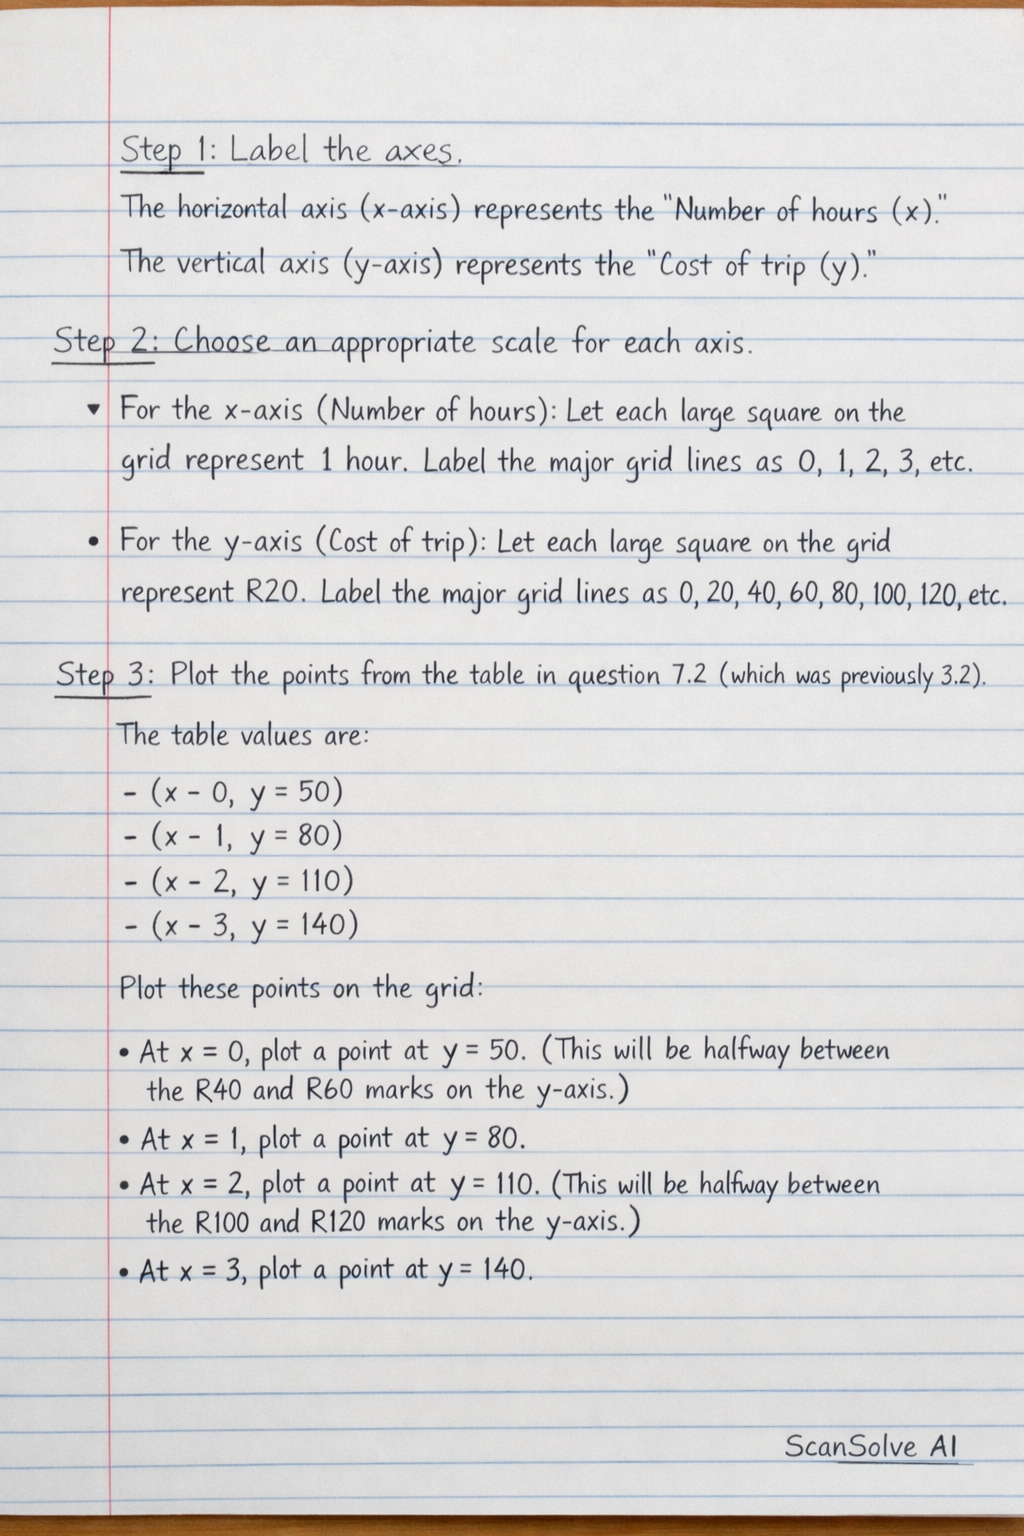
4 stepsLabel the axes.
The horizontal axis (x-axis) represents the "Number of hours ()".
The vertical axis (y-axis) represents the "Cost of trip ()".Choose an appropriate scale for each axis.
- For the x-axis (Number of hours): Let each large square on the grid represent 1 hour. Label the major grid lines as 0, 1, 2, 3, etc.
- For the y-axis (Cost of trip): Let each large square on the grid represent R20. Label the major grid lines as 0, 20, 40, 60, 80, 100, 120, 140, etc.
Plot the points from the table in question 7.2 (which was previously 3.2).
The table values are:
Plot these points on the grid:
- At , plot a point at . (This will be halfway between the R40 and R60 marks on the y-axis).
- At , plot a point at .
- At , plot a point at . (This will be halfway between the R100 and R120 marks on the y-axis).
- At , plot a point at .
Draw a straight line connecting the plotted points.
Since the relationship is linear, the points will form a straight line. Draw a line through all the plotted points.
The graph should show the x-axis labeled "Number of hours (x)" with a scale (e.g., 1 large square = 1 hour) and the y-axis labeled "Cost of trip (y)" with a scale (e.g., 1 large square = R20). The points (0, 50), (1, 80), (2, 110), and (3, 140) should be plotted and connected by a straight line.
Still stuck on this one?
Ask a follow-up, and the answer starts from this question.
More Mathematics Questions
Handwritten Step-by-Step Solution
Get this as a handwritten image on WhatsApp — like a tutor wrote it for you.
Try on WhatsApp