
We read your photo as:
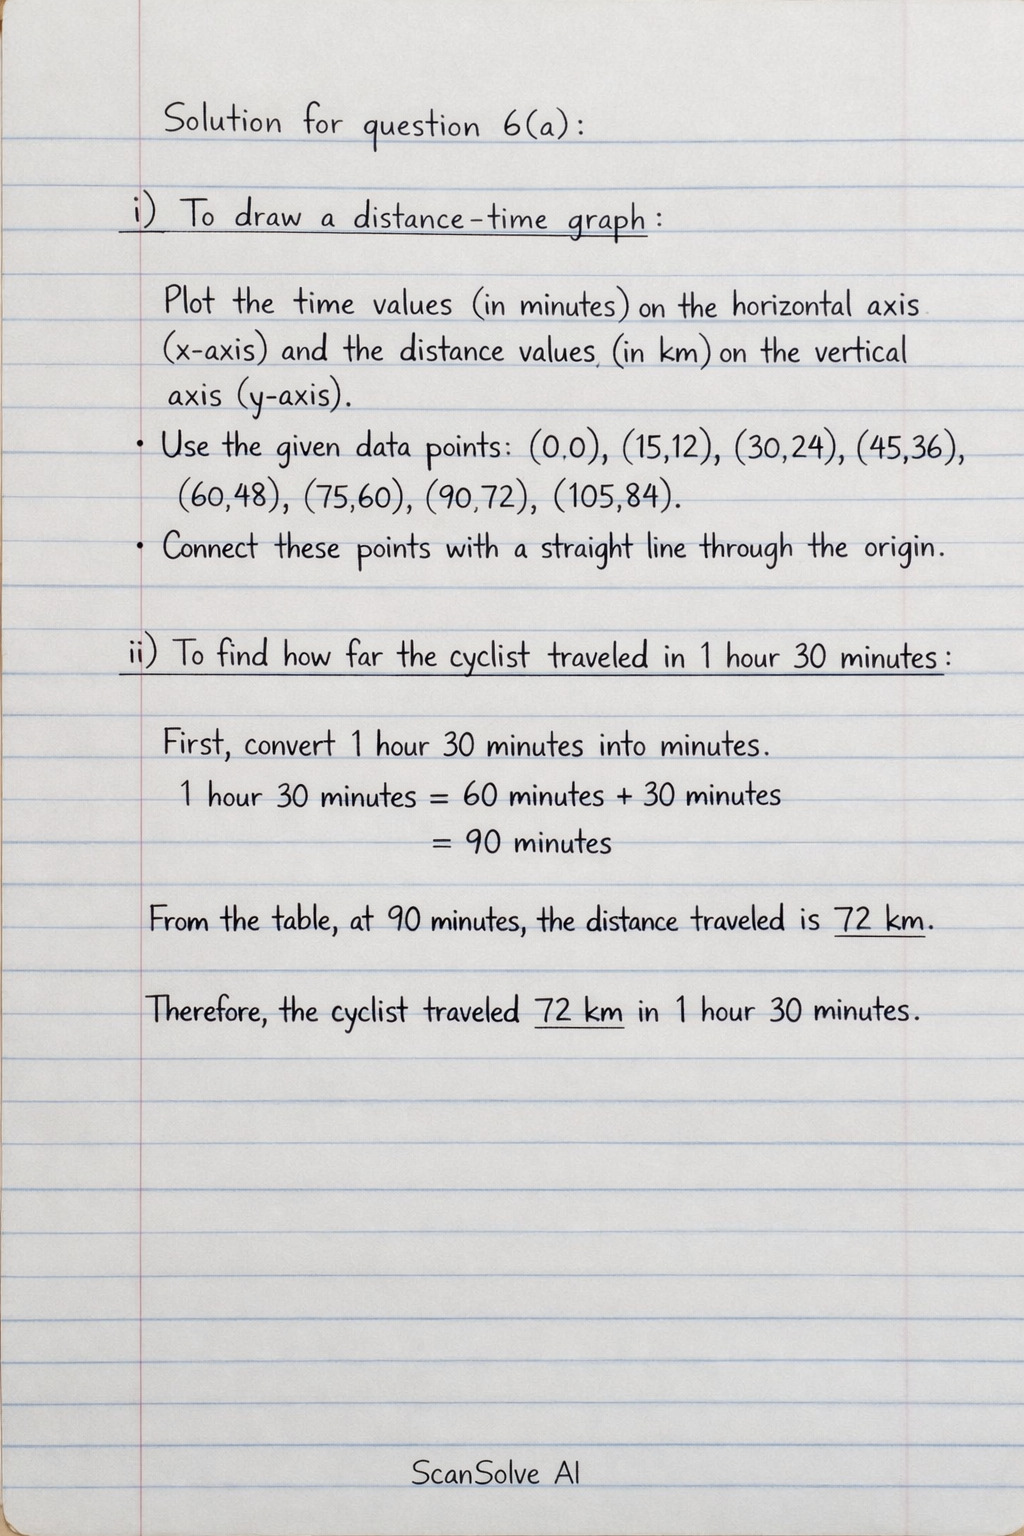
I) To draw a distance-time graph, plot the time values (in minutes) on the horizontal axis (x-axis) and the distance values (in km) on the vertical axis (y-axis). Use the given data points: (0,0),
ScanSolve AI Answer
Answer
Here's the solution for question 6(a):
a)
i) To draw a distance-time graph, plot the time values (in minutes) on the horizontal axis (x-axis) and the distance values (in km) on the vertical axis (y-axis). Use the given data points: , , , , , , , and . Since the cyclist travels at a constant speed, connect these points with a straight line passing through the origin.
ii) To find how far the cyclist traveled in 1 hour 30 minutes:
First, convert 1 hour 30 minutes into minutes.
From the table, at 90 minutes, the distance traveled is 72 km.
Therefore, the cyclist traveled 72 km in 1 hour 30 minutes.
iii) To determine the speed of the cyclist, use the formula:
We can pick any data point from the table (excluding the origin) to calculate the constant speed. Let's use the point where time is 60 minutes and distance is 48 km.
First, convert the time to hours:
Now, calculate the speed:
The speed of the cyclist is .
Try one yourself
A new problem that tests the same skill.
Still stuck on this one?
Ask a follow-up, and the answer starts from this question.
More English Questions
Handwritten Step-by-Step Solution
Get this as a handwritten image on WhatsApp — like a tutor wrote it for you.
Try on WhatsApp