
This mathematics problem involves applying core mathematical principles and formulas. Below you will find a complete step-by-step solution with detailed explanations for each step, helping you understand not just the answer but the method behind it.
ScanSolve AI Answer
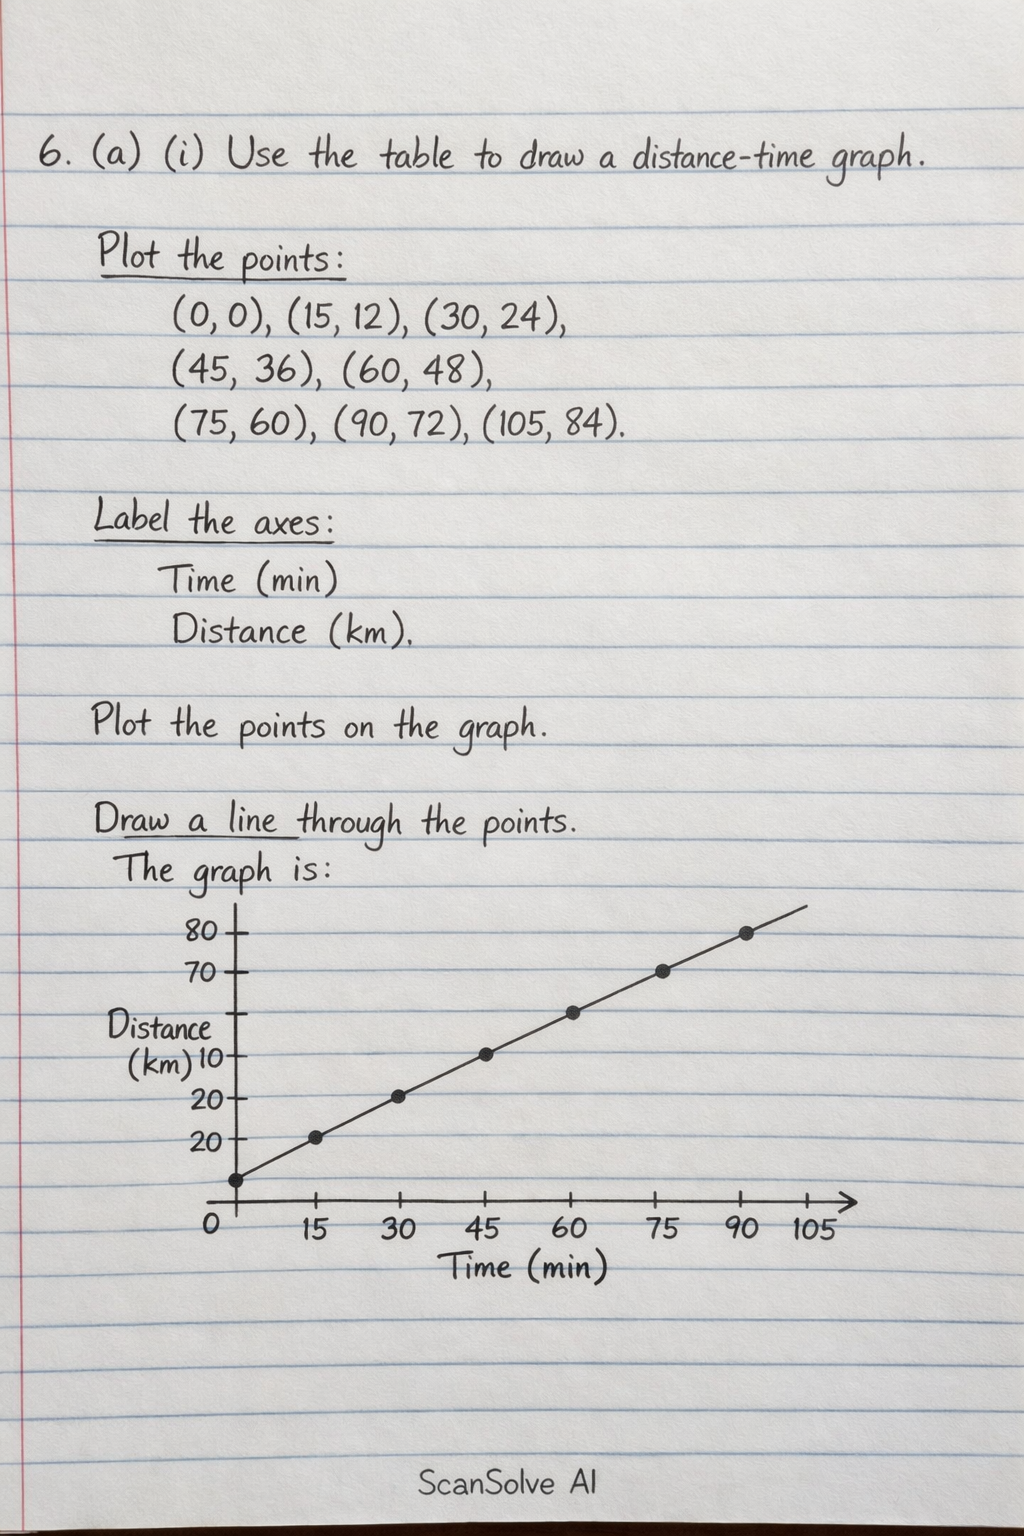
Here are the answers to all the questions from the image. 6. (a) (i) Use the table to draw a distance-time graph. To draw the graph, plot the given points (Time in minutes, Distance in km) on a coordinate plane. Time should be on the x-axis and Distance on the y-axis. The points to plot are: (0,0), (15,12), (30,24), (45,36), (60,48), (75,60), (90,72), (105,84). Since the speed is constant, the graph will be a straight line passing through these points. *(ii) Using the