
This mathematics problem involves applying core mathematical principles and formulas. Below you will find a complete step-by-step solution with detailed explanations for each step, helping you understand not just the answer but the method behind it.
ScanSolve AI Answer
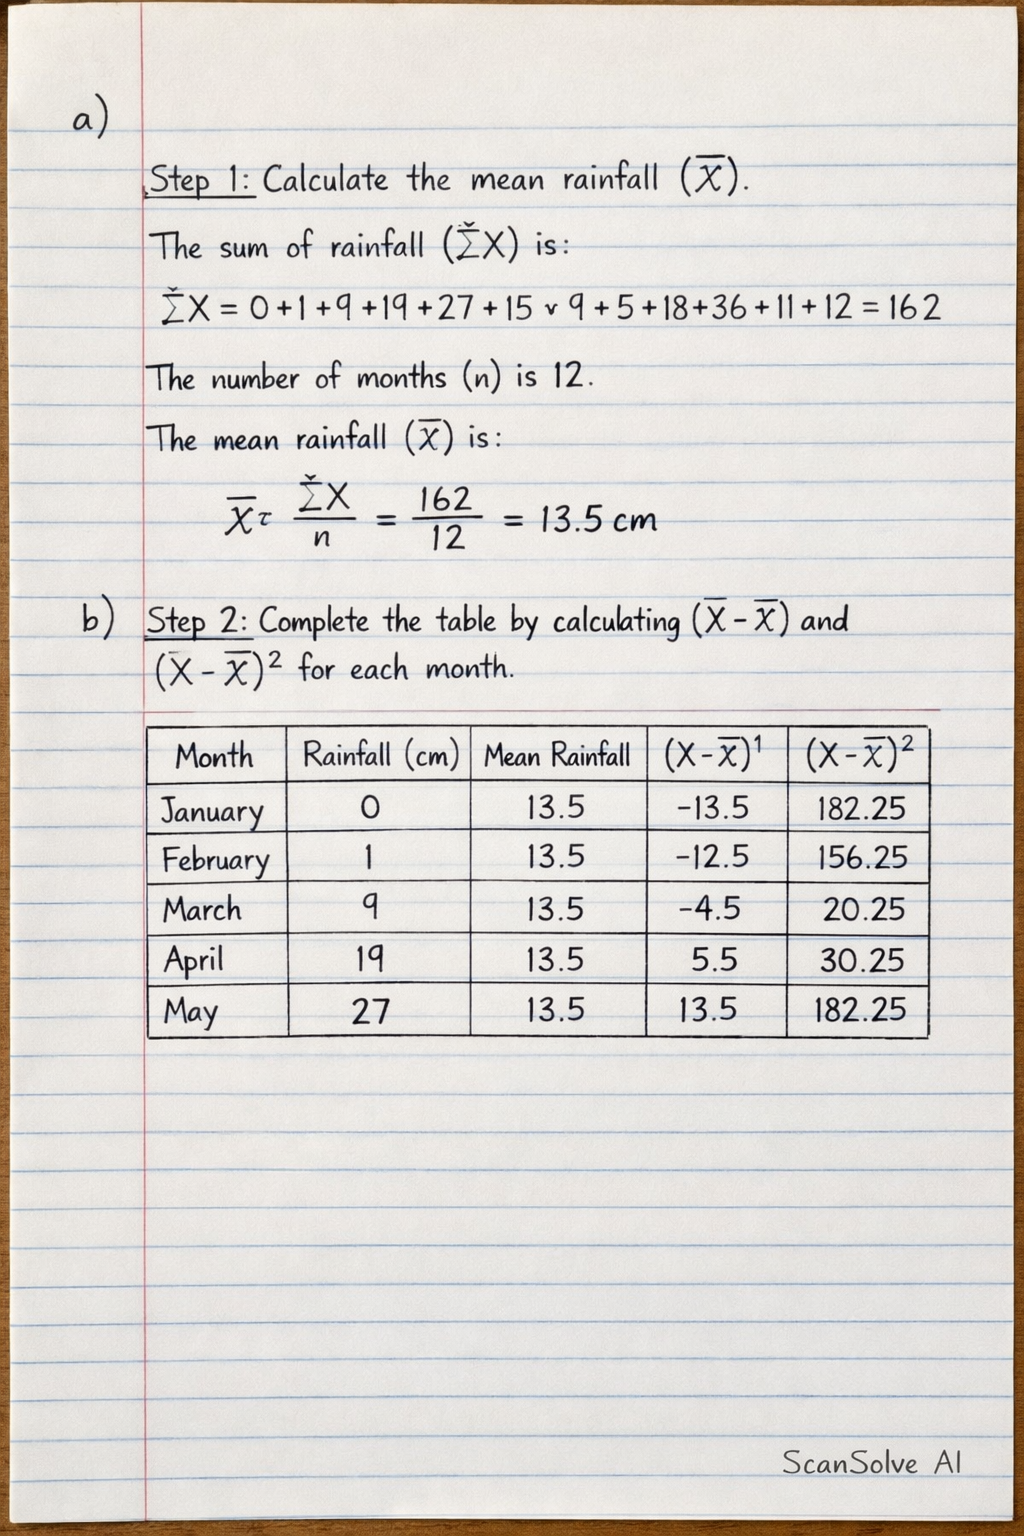
a) Step 1: Calculate the mean rainfall (X). The sum of rainfall ( X) is: X = 0 + 1 + 9 + 19 + 27 + 15 + 9 + 5 + 18 + 36 + 11 + 12 = 162 The number of months (n) is 12. The mean rainfall (X) is: X = ( X)/(n) = (162)/(12) = 13.5 cm Step 2: Complete the table by calculating (X - X) and (X - X)^2 for each month. | Month | Rainfall (cm) (X) | Mean Rainfall (X) | (X - X) | (X - X)^2 | | :-------- | :------------------ | :------------------------ | :-------------- | :---------------- | | January | 0 | 13.5 | -13.5 | 182.25 | | February | 1 | 13.5 | -12.5 | 156.25 | | March | 9 | 13.5 | -4.5 | 20.25 | | April | 19 | 13.5 | 5.5 | 30.25 | | May | 27 | 13.5 | 13.5 | 182.25 | | June | 15 | 13.5 | 1.5 | 2.25 | | July | 9 | 13.5 | -4.5 | 20.25 | | August | 5 | 13.5 | -8.5 | 72.25 | | September | 18 | 13.5 | 4.5 | 20.25 | | October | 36 | 13.5 | 22.5 | 506.25 | | November | 11 | 13.5 | -2.5 | 6.25 | | December | 12 | 13.5 | -1.5 | 2.25 | | Total | 162 | | 0 | 1203 | The sum of (X - X)^2 is (X - X)^2 = 1203. b) i) Step 1: Calculate the Standard Deviation (). Using the formula = sqrt( (X-X))^2n: = sqrt((1203)/(12)) = sqrt(100.25) ≈ 10.01249 Rounding to two decimal places: The standard deviation is 10.01 cm. Significance: The standard deviation of 10.01 cm indicates the average amount of variation or dispersion of the monthly rainfall data around the mean rainfall of 13.5 cm. A higher value would imply greater variability in rainfall, while a lower value would suggest rainfall amounts are more consistent from month to month. ii) Two advantages of using Standard Deviation are: • It considers every observation in the dataset, making it a comprehensive measure of dispersion. • It is expressed in the same units as the original data, which makes it easy to interpret and compare. iii) Step 1: Calculate the Coefficient of Variation (CV). Using the formula CV = Standard DeviationMean × 100: CV = (10.01249)/(13.5) × 100 CV ≈ 0.741666 × 100 CV ≈ 74.17\% Rounding to two decimal places: The Coefficient of Variation is 74.17%. c) i) To represent the information on monthly rainfall using simple bar graphs: • Draw a horizontal axis labeled "Month" and a vertical axis labeled "Rainfall (cm)". • For each month (January to December), draw a vertical bar. • The height of each bar should correspond to the rainfall value for that specific month as given in the table. • Ensure all bars are of equal width and are separated by equal spaces. • Provide a clear title for the graph, such as "Monthly Rainfall in Sangmelima". ii) The distribution of rainfall shows a bimodal pattern. There is very low rainfall at the beginning of the year (January-February), followed by an increase to a first peak in May (27 cm). Rainfall then decreases in July-August before rising to a second, higher peak in October (36 cm). Rainfall then declines towards the end of the year (November-December). This indicates two distinct rainy seasons. d) i) Step 1: Determine the maximum and minimum rainfall values. Maximum rainfall = 36 cm (October) Minimum rainfall = 0 cm (January) Step 2: Calculate the annual rainfall range. Range = Maximum Rainfall - Minimum Rainfall Range = 36 cm - 0 cm = 36 cm The annual rainfall range is 36 cm.