
We read your photo as:
Show the numbers of the different types of restaurants in a pictograph using the food picture you designed.
ScanSolve AI Answer
Step-by-step solution
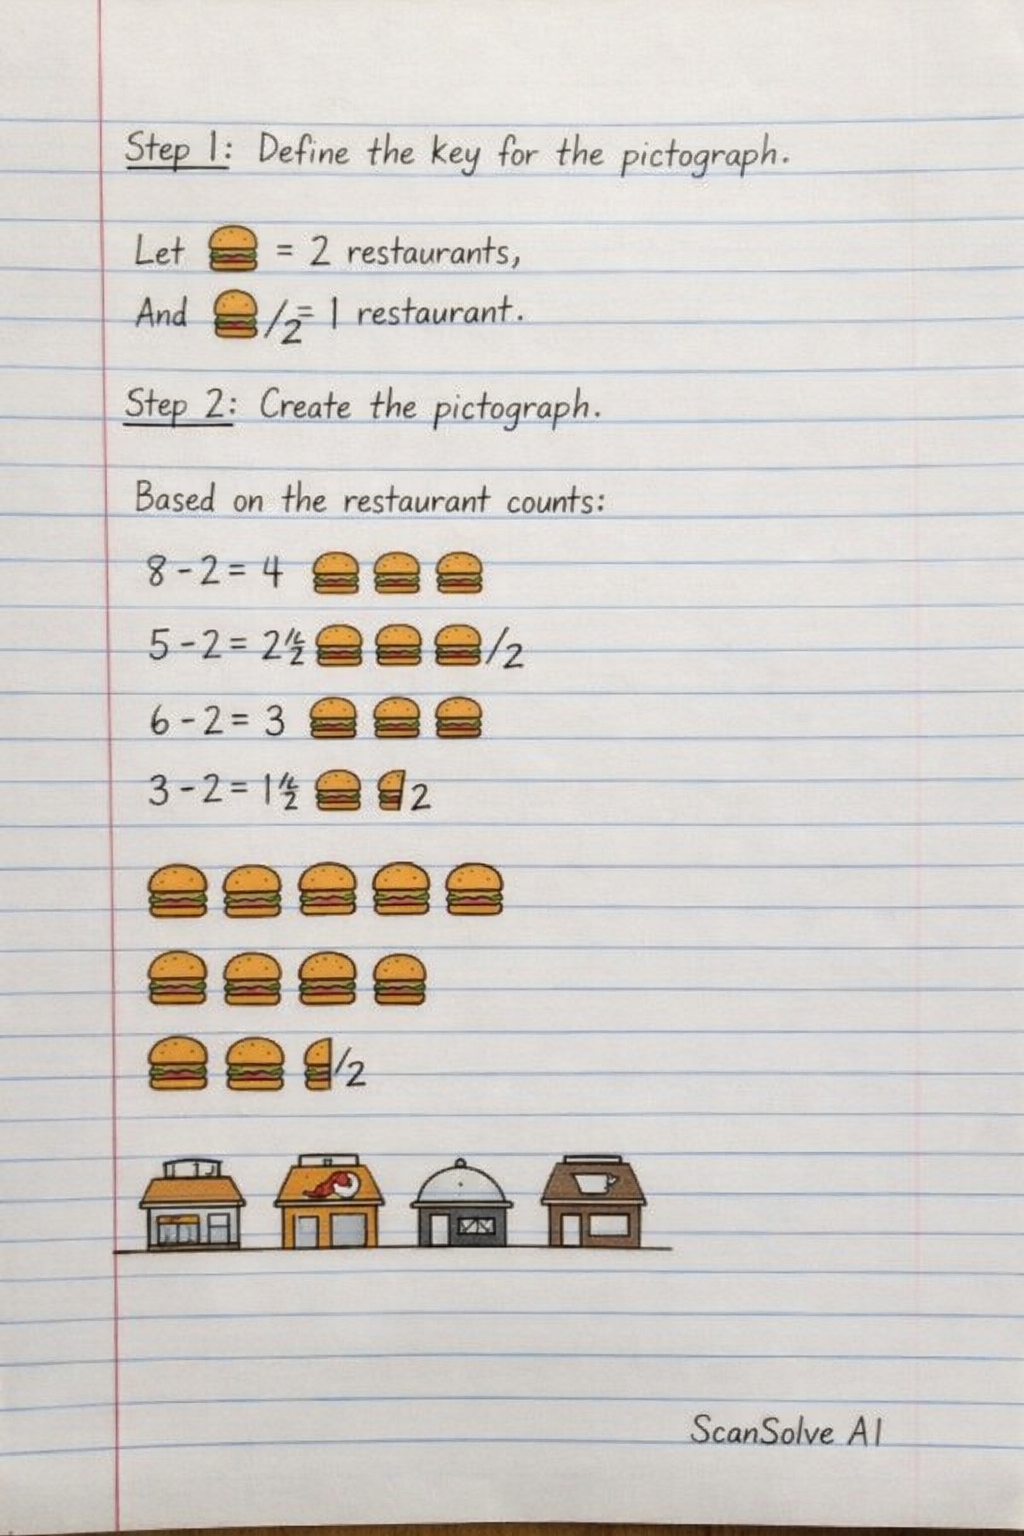
2 stepsHere is the pictograph based on the restaurant data and the food picture you designed.
Define the key for the pictograph.
We will use the burger drawing you designed as the symbol. To represent the numbers efficiently, we'll set a key where one symbol represents multiple restaurants.
Let represent 2 restaurants.
A half burger symbol, , will represent 1 restaurant.Create the pictograph.
Based on the restaurant counts from the previous questions and assuming the building icons at the bottom of the grid correspond to the restaurant types in the order they appeared in the table, here is the pictograph:
This table represents how you would draw the burger symbols in the grid provided, with each row corresponding to a column in the grid.
Still stuck on this one?
Ask a follow-up, and the answer starts from this question.
More Mathematics Questions
Handwritten Step-by-Step Solution
Get this as a handwritten image on WhatsApp — like a tutor wrote it for you.
Try on WhatsApp