
We read your photo as:
Use the information in the table to draw a pictograph. The heading of your pictograph should be: Foods we eat most often. Choose your own pictures to show the data.
ScanSolve AI Answer
Step-by-step solution
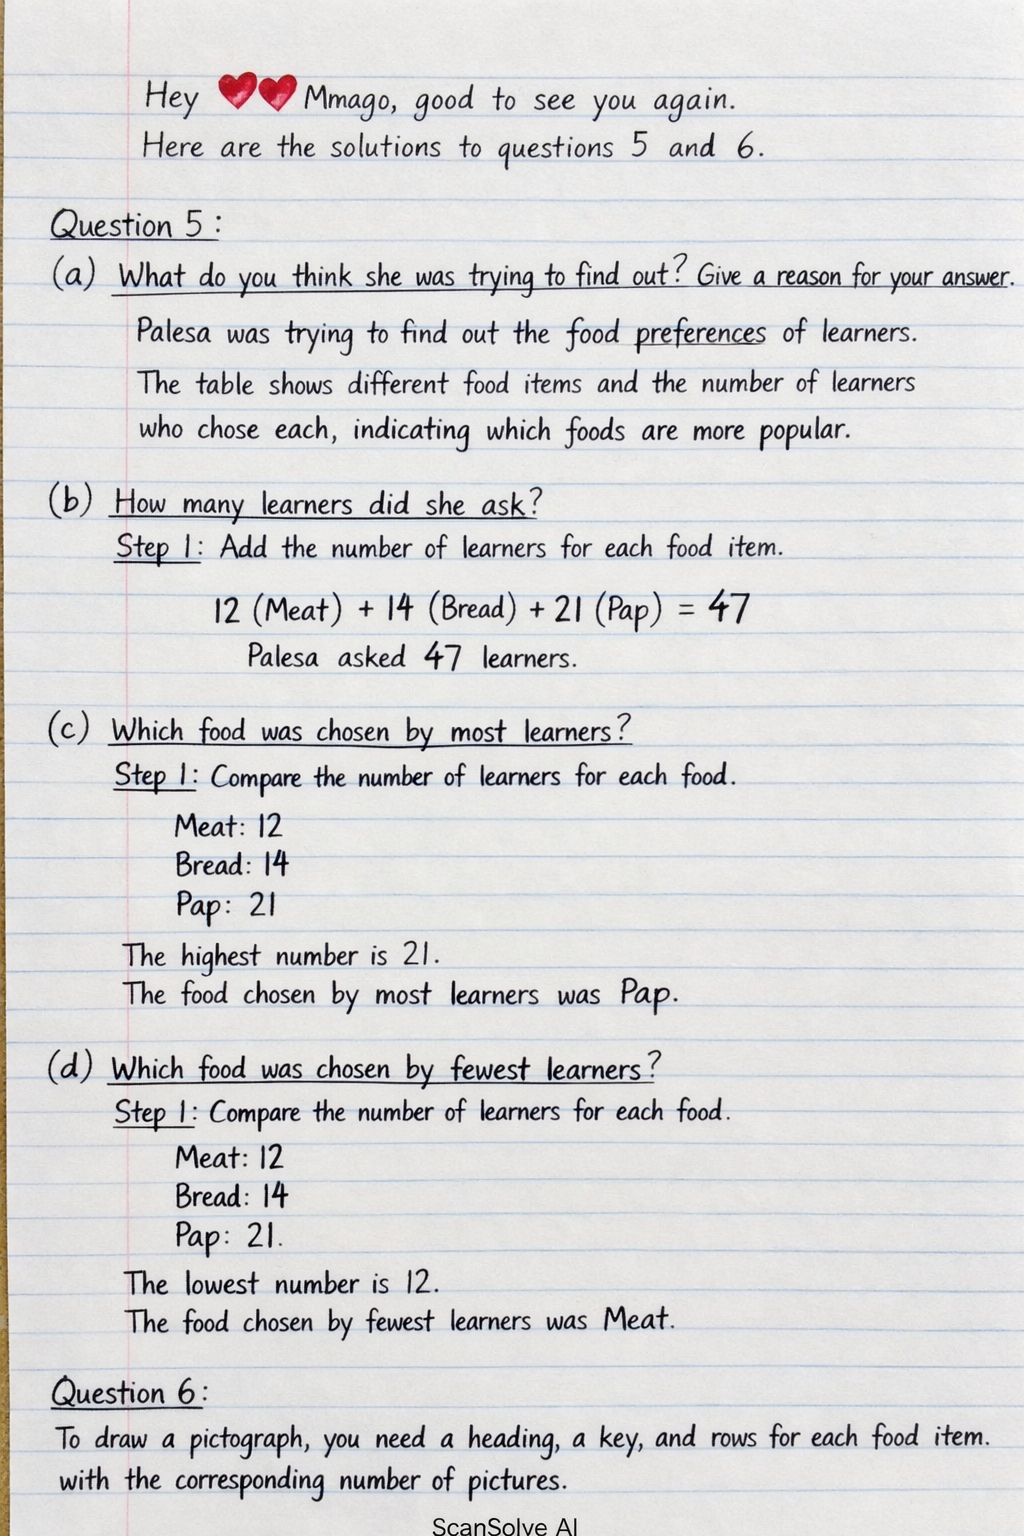
3 stepsHere are the solutions to questions 5 and 6.
Part 5
Part a
What do you think she was trying to find out? Give a reason for your answer.
Palesa was trying to find out the food preferences of learners. The table shows different food items and the number of learners who chose each, indicating which foods are more popular.
Part b· 1 step
How many learners did she ask?
Add the number of learners for each food item.
Palesa asked 47 learners.
Part c· 1 step
Which food was chosen by most learners?
Compare the number of learners for each food.
Meat: 12
Bread: 14
Pap: 21
The highest number is 21.
The food chosen by most learners was Pap.
Part d· 1 step
Which food was chosen by fewest learners?
Compare the number of learners for each food.
Meat: 12
Bread: 14
Pap: 21
The lowest number is 12.
The food chosen by fewest learners was Meat.
Part 6
To draw a pictograph, you need a heading, a key, and rows for each food item with the corresponding number of pictures.
- Heading: Foods we eat most often
- Key: Let one picture (e.g., a small plate 🍽️) represent 2 learners.
Here's how the pictograph would be structured:
- Meat (12 learners): 🍽️ 🍽️ 🍽️ 🍽️ 🍽️ 🍽️ (6 pictures, since )
- Bread (14 learners): 🍽️ 🍽️ 🍽️ 🍽️ 🍽️ 🍽️ 🍽️ (7 pictures, since )
- Pap (21 learners): 🍽️ 🍽️ 🍽️ 🍽️ 🍽️ 🍽️ 🍽️ 🍽️ 🍽️ 🍽️ 🍽️ (10 full pictures and 1 half picture, since )
Still stuck on this one?
Ask a follow-up, and the answer starts from this question.
More Mathematics Questions
Handwritten Step-by-Step Solution
Get this as a handwritten image on WhatsApp — like a tutor wrote it for you.
Try on WhatsApp