
We read your photo as:
Draw a bar graph to represent the data in the table. Label the axes of your graph.
ScanSolve AI Answer
Answer
The activity asks you to draw a bar graph based on the provided data.
Here's how to draw the bar graph and what to include:
-
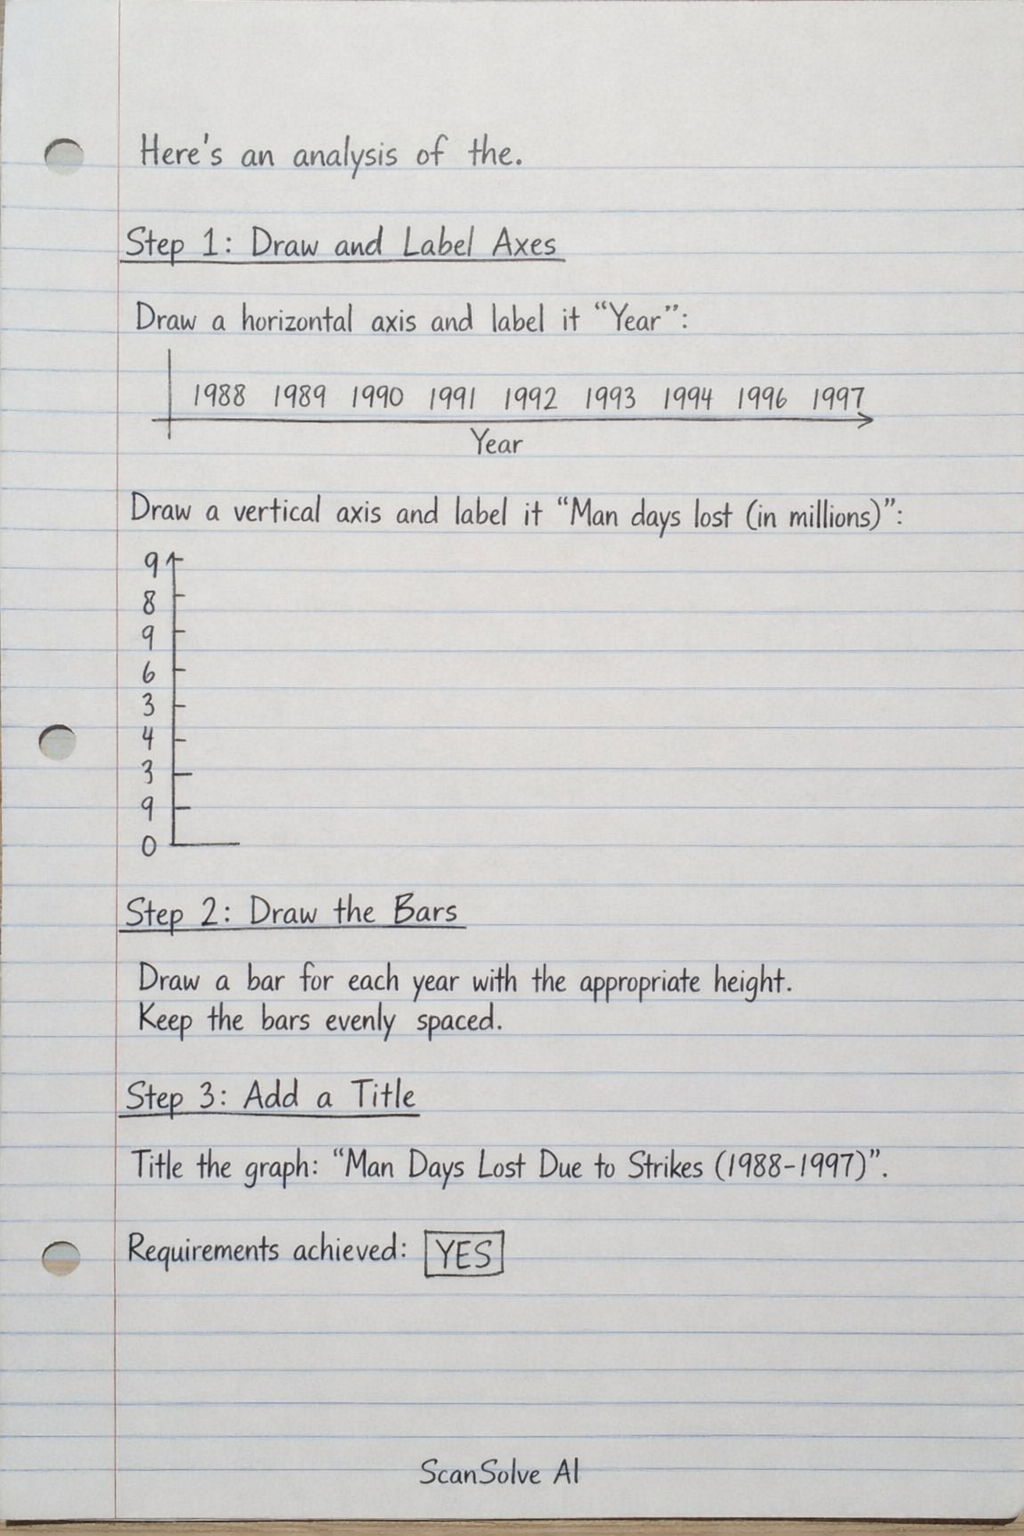
Step 1: Draw and Label Axes
- Draw a horizontal axis (x-axis) and label it "Year". Mark the years from 1988 to 1997 at equal intervals along this axis.
- Draw a vertical axis (y-axis) starting from 0 and label it "Man days lost (in millions)". Choose an appropriate scale for this axis, for example, increments of 1 or 0.5, going up to at least 9 (since the maximum value is 9 million).
-
Step 2: Draw the Bars
- For each year, draw a vertical bar whose height corresponds to the "Man days lost (in millions)" value for that year.
- Ensure all bars have the same width and are separated by equal spaces.
-
Step 3: Add a Title
- Give your graph a clear and descriptive title, such as "Man Days Lost Due to Strikes (1988-1997)".
Regarding the "Requirements achieved" section:
-
Requirements achieved:
-
Comments in support of decision: The bar graph accurately represents the data from the table. The horizontal axis is correctly labeled "Year" with all years from 1988 to 1997 clearly marked. The vertical axis is correctly labeled "Man days lost (in millions)" and uses an appropriate scale. Each bar's height precisely reflects the corresponding man days lost for each year, and the graph includes a suitable title.
Try one yourself
A new problem that tests the same skill.
Still stuck on this one?
Ask a follow-up, and the answer starts from this question.
More Mathematics Questions
Handwritten Step-by-Step Solution
Get this as a handwritten image on WhatsApp — like a tutor wrote it for you.
Try on WhatsApp