
This mathematics problem involves applying core mathematical principles and formulas. Below you will find a complete step-by-step solution with detailed explanations for each step, helping you understand not just the answer but the method behind it.
ScanSolve AI Answer
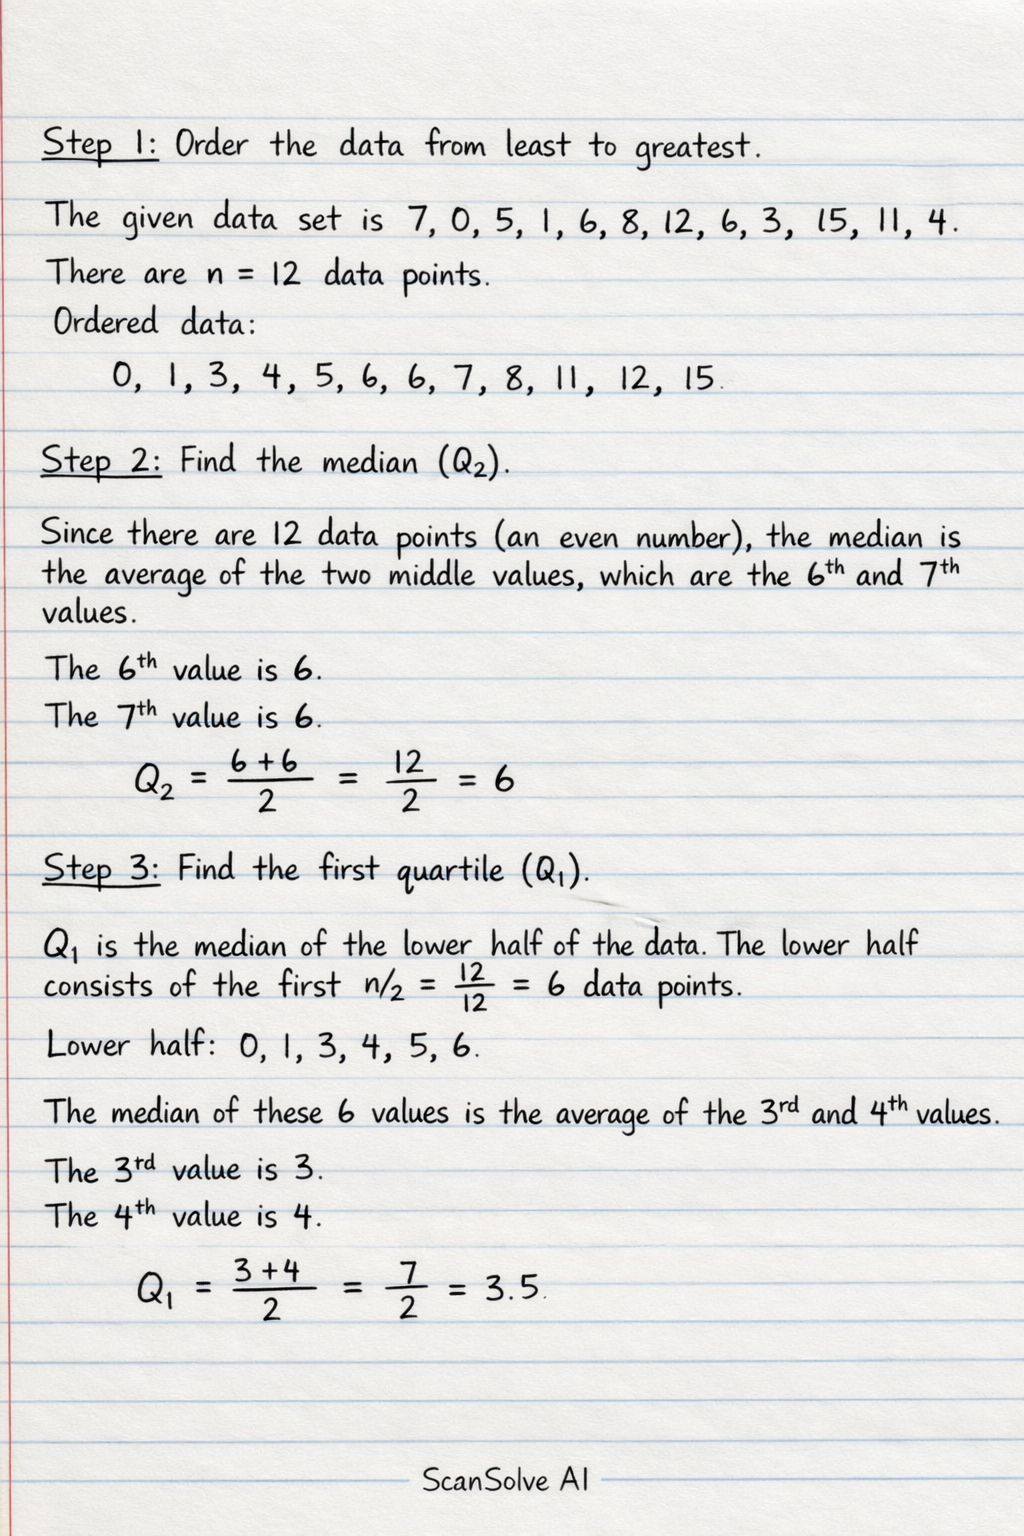
Step 1: Order the data from least to greatest. The given data set is 7, 0, 5, 1, 6, 8, 12, 6, 3, 15, 11, 4. There are n=12 data points. Ordered data: 0, 1, 3, 4, 5, 6, 6, 7, 8, 11, 12, 15 Step 2: Find the median (Q_2). Since there are 12 data points (an even number), the median is the average of the two middle values, which are the 6th and 7th values. The 6th value is 6. The 7th value is 6. Q_2 = (6+6)/(2) = (12)/(2) = 6 Step 3: Find the first quartile (Q_1). Q_1 is the median of the lower half of the data. The lower half consists of the first n/2 = 12/2 = 6 data points. Lower half: 0, 1, 3, 4, 5, 6. The median of these 6 values is the average of the 3rd and 4th values. The 3rd value is 3. The 4th value is 4. Q_1 = (3+4)/(2) = (7)/(2) = 3.5 Step 4: Find the third quartile (Q_3). Q_3 is the median of the upper half of the data. The upper half consists of the last n/2 = 12/2 = 6 data points. Upper half: 6, 7, 8, 11, 12, 15. The median of these 6 values is the average of the 3rd and 4th values. The 3rd value is 8. The 4th value is 11. Q_3 = (8+11)/(2) = (19)/(2) = 9.5 Step 5: Calculate the Interquartile Range (IQR). The interquartile range is the difference between the third quartile and the first quartile. IQR = Q_3 - Q_1 IQR = 9.5 - 3.5 IQR = 6 The interquartile range is 6.