
We read your photo as:
Calculate the range for this set: 4, 5, 6, 8, 8, 10, 10. Highest: 10. Lowest: 4.
Mathematics
ScanSolve AI Answer
Step-by-step solution
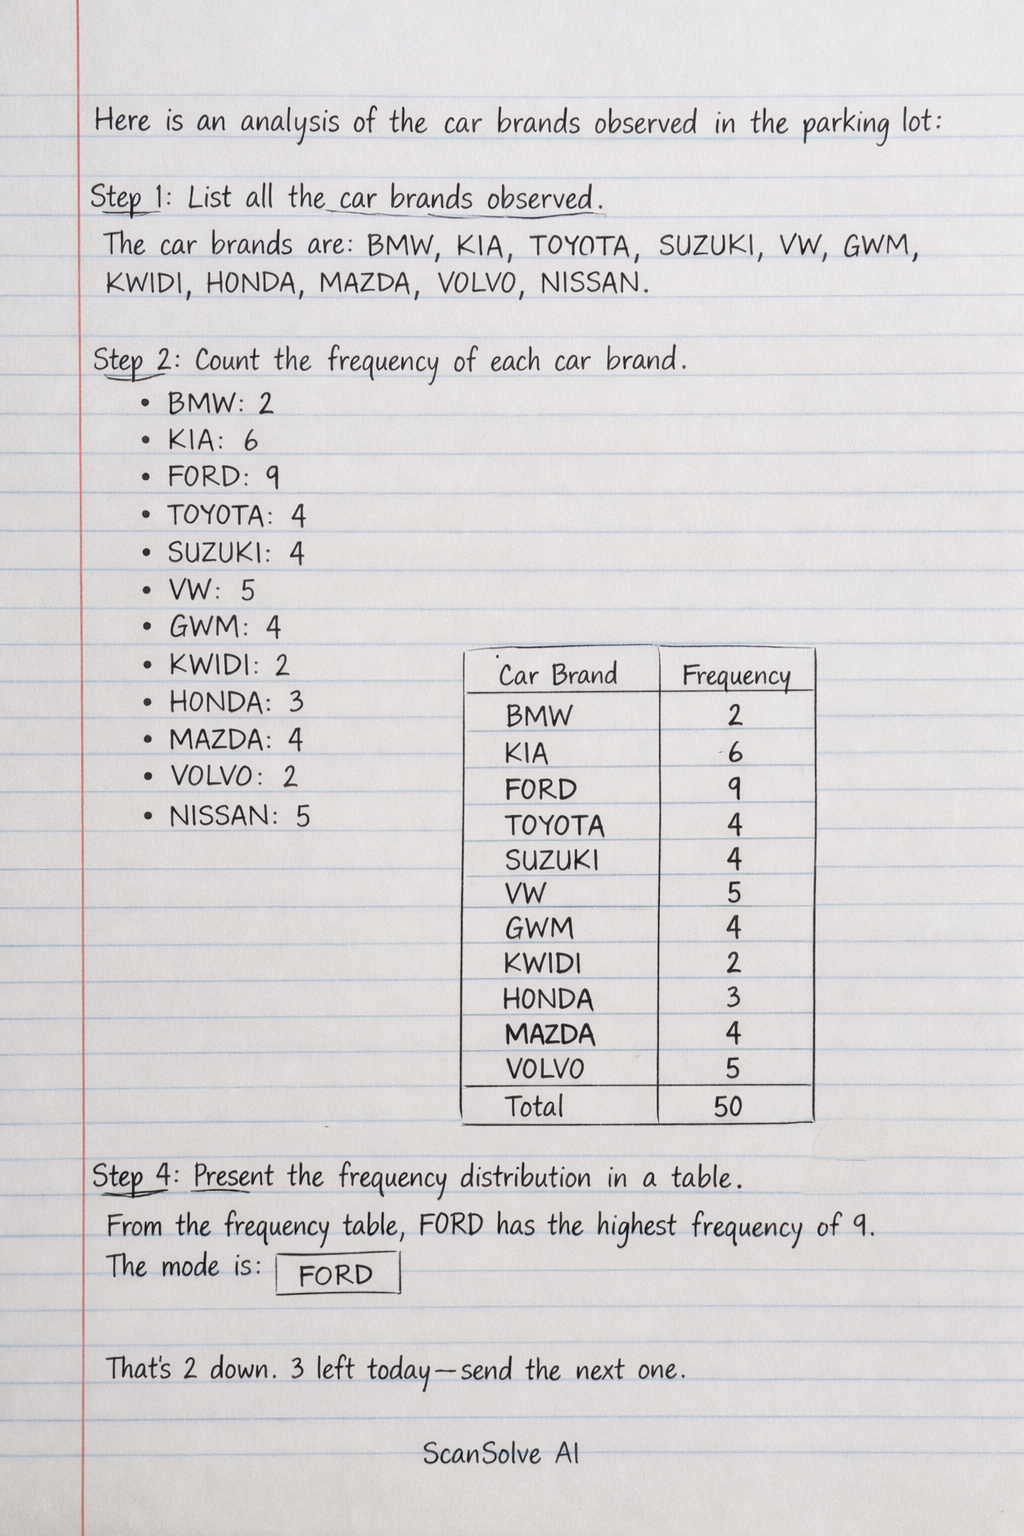
4 stepsHere is an analysis of the car brands observed in the parking lot:
List all the car brands observed.
The car brands are: BMW, KIA, FORD, TOYOTA, SUZUKI, VW, GWM, KWIDI, HONDA, MAZDA, VOLVO, NISSAN.
Count the frequency of each car brand.
- BMW: 2
- KIA: 6
- FORD: 9
- TOYOTA: 4
- SUZUKI: 4
- VW: 5
- GWM: 4
- KWIDI: 2
- HONDA: 3
- MAZDA: 4
- VOLVO: 2
- NISSAN: 5
Present the frequency distribution in a table.
Identify the mode (the car brand with the highest frequency).
From the frequency table, FORD has the highest frequency of 9.
The mode is:
Was this helpful?
Still stuck on this one?
Ask a follow-up, and the answer starts from this question.
Got a different question?Ask your own question
More Mathematics Questions
QCalculate the range for the following two sets of data: Set 1: 60, 40, 30, 50, 60, 40, 70. Set 2…QCalculate the square of the range for the following set of numbers 14, 13, 10.QCalculate the mean, mode, and range for the following data set: 4.9, 5.6, 6.2, 6.6, 6.6, 6.8, 7.8…QFind the interquartile range for the following set of data: 7, 0, 5, 1, 6, 8, 12, 6, 3, 15, 11 and…QFind the range and coefficient of range from the following data. 15, 20, 18, 12,20, 28, 25
Handwritten Step-by-Step Solution
Get this as a handwritten image on WhatsApp — like a tutor wrote it for you.
Try on WhatsApp