
We read your photo as:
Study the second graph. Then write a short paragraph summarising what you have learnt from it.
ScanSolve AI Answer
Step-by-step solution
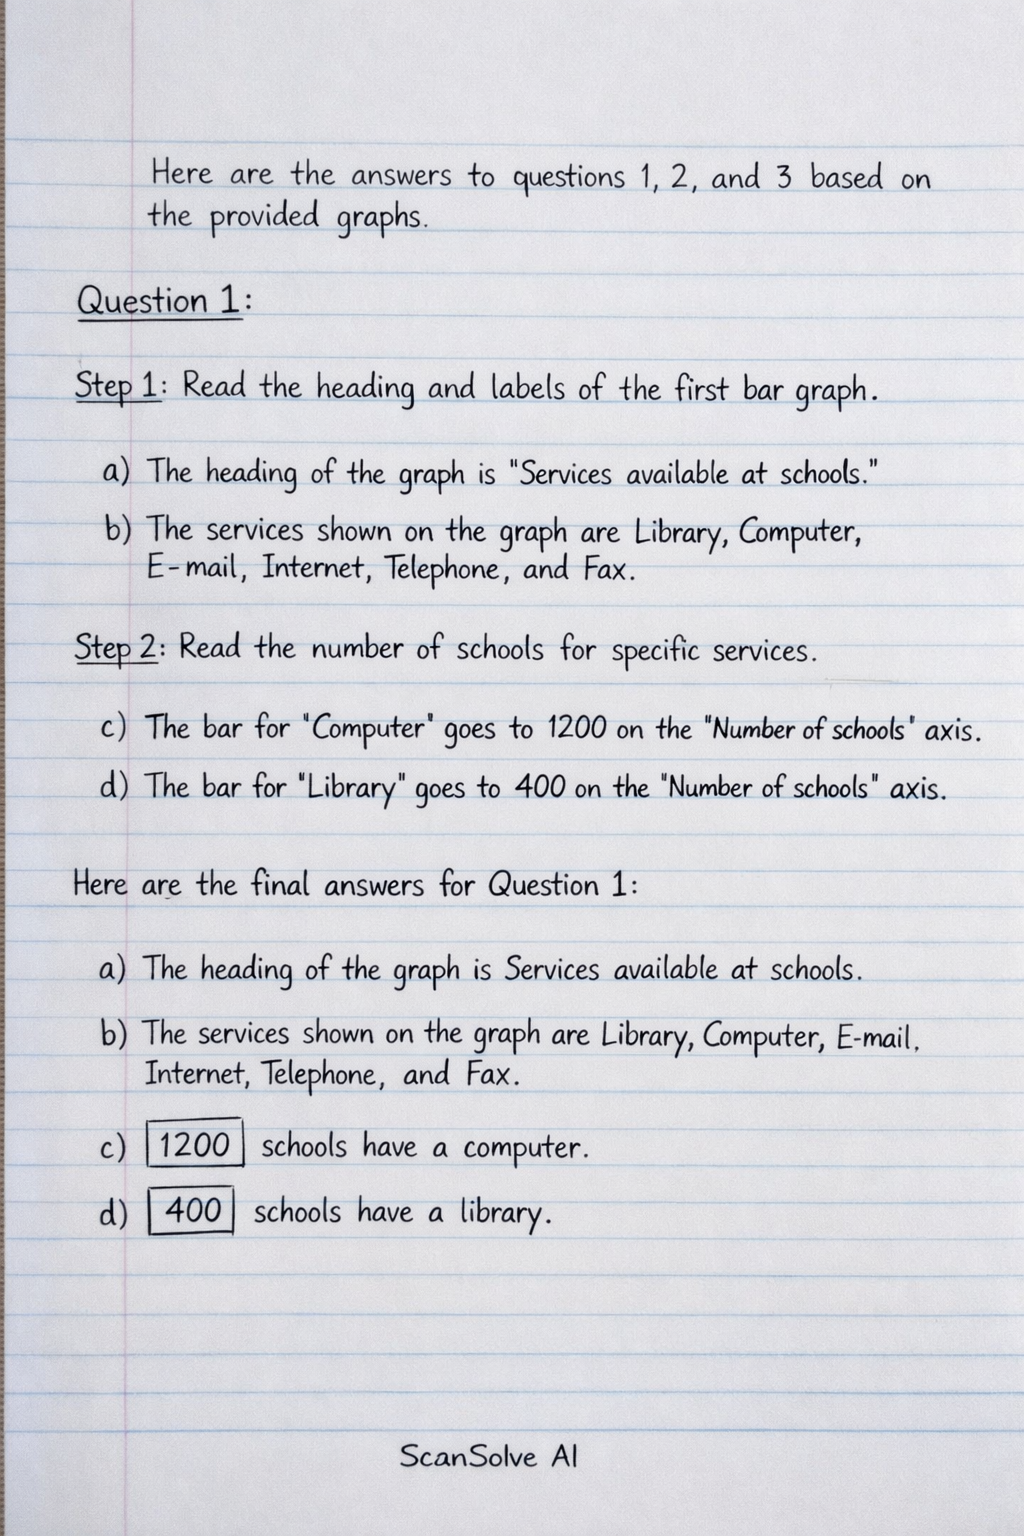
5 stepsHere are the answers to questions 1, 2, and 3 based on the provided graphs.
Question 1:
Read the heading and labels of the first bar graph.
a) The heading of the graph is "Services available at schools".
b) The services shown on the graph are Library, Computer, E-mail, Internet, Telephone, and Fax.
Read the number of schools for specific services from the first bar graph.
c) The bar for "Computer" extends to 1200 on the "Number of schools" axis.
d) The bar for "Library" extends to 400 on the "Number of schools" axis.
Here are the final answers for Question 1:
a) The heading of the graph is Services available at schools.
b) The services shown on the graph are Library, Computer, E-mail, Internet, Telephone, and Fax.
c) schools have a computer.
d) schools have a library.
Question 2:
Calculate the fractions of the total surveyed schools (2500).
a) of 2500 schools is schools.
The service with just over 1250 schools is Telephone (1400 schools).b) of 2500 schools is schools.
The service with just under 625 schools is Fax (600 schools).c) of 2500 schools is schools.
The service with less than 500 schools is Library (400 schools). Only one service fits this criterion.Here are the final answers for Question 2:
a) Just over of the schools have .
b) Just under of the schools have .
c) Less than of the schools have or (only one service fits).
Question 3:
Analyze the second bar graph.
The second graph, also titled "Services available at schools", shows the number of schools (on a scale of 0 to 10) that have various services.
- Computer and Telephone are the most common services, each available in 10 schools.
- E-mail is available in 8 schools.
- Library is available in 7 schools.
- Internet is available in 6 schools.
- Fax is the least common service, available in 5 schools.
Summarize the findings in a short paragraph.
This graph illustrates the availability of different services in a small sample of schools. It shows that Computer and Telephone services are the most prevalent, each found in 10 schools. E-mail and Library are also quite common, while Internet is slightly less so. The Fax service is the least common among those listed, being available in only 5 schools.
Still stuck on this one?
Ask a follow-up, and the answer starts from this question.
More Mathematics Questions
Handwritten Step-by-Step Solution
Get this as a handwritten image on WhatsApp — like a tutor wrote it for you.
Try on WhatsApp