
This mathematics problem involves applying core mathematical principles and formulas. Below you will find a complete step-by-step solution with detailed explanations for each step, helping you understand not just the answer but the method behind it.
ScanSolve AI Answer
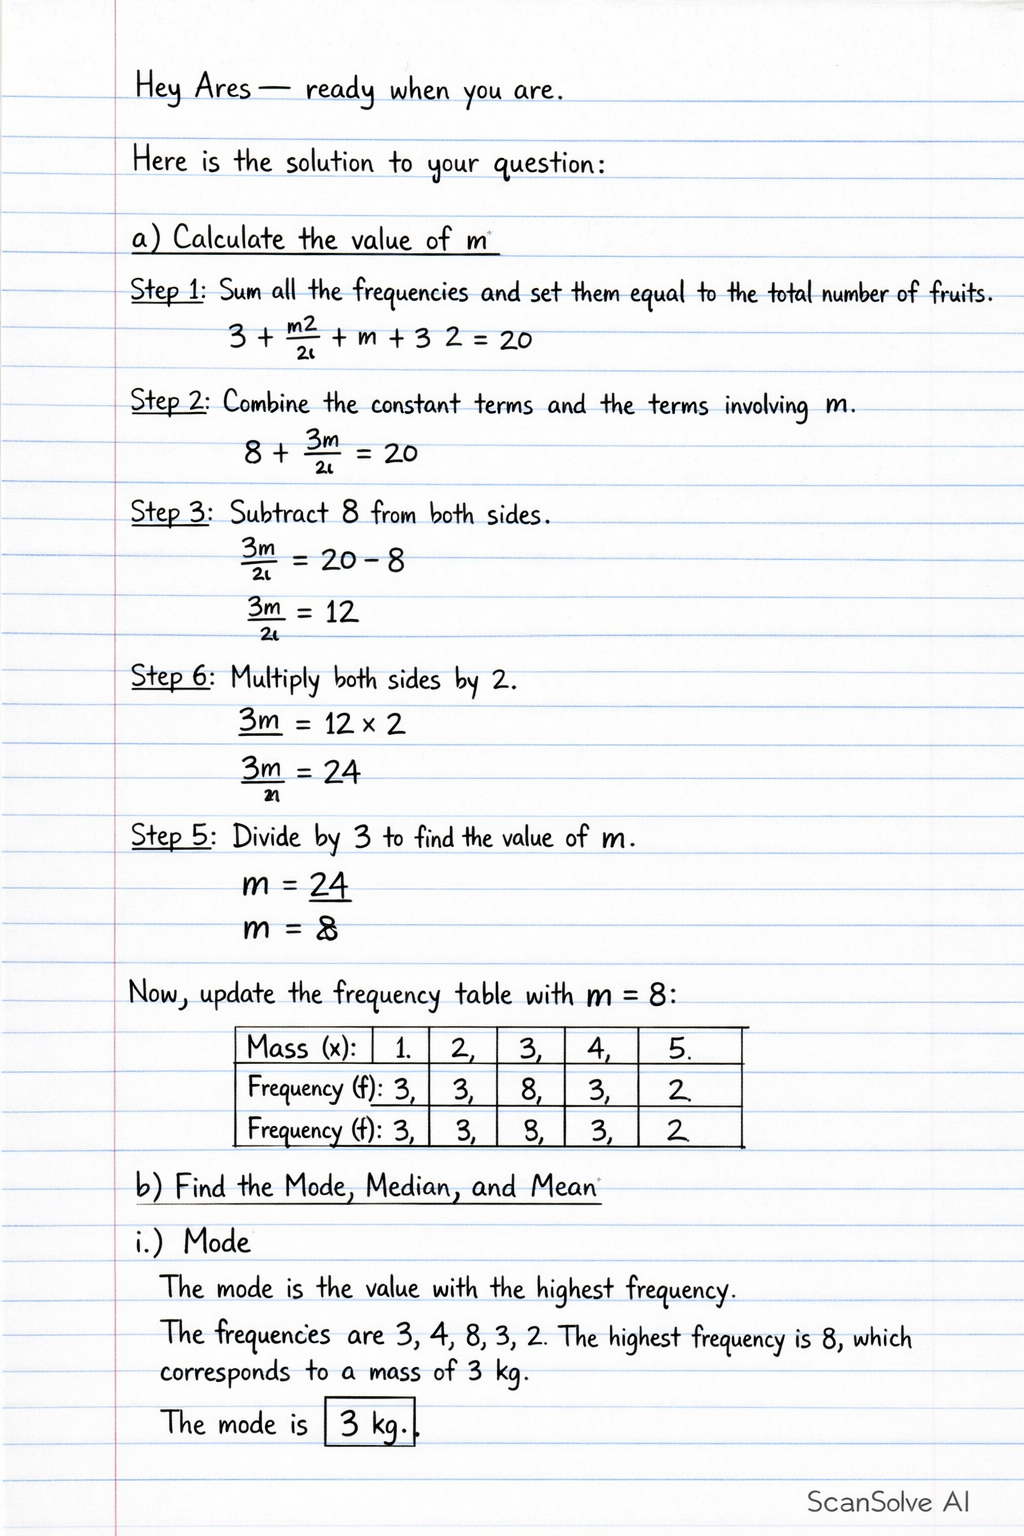
Hey Ares — ready when you are. Here is the solution to your question: The data shows the mass (in kilograms) of 20 fruits in a basket. Mass (x): 1, 2, 3, 4, 5 Frequency (f): 3, m/2, m, 3, 2 Total number of fruits = 20. a) Calculate the value of m Step 1: Sum all the frequencies and set them equal to the total number of fruits. 3 + (m)/(2) + m + 3 + 2 = 20 Step 2: Combine the constant terms and the terms involving m. 8 + (3m)/(2) = 20 Step 3: Subtract 8 from both sides. (3m)/(2) = 20 - 8 (3m)/(2) = 12 Step 4: Multiply both sides by 2. 3m = 12 × 2 3m = 24 Step 5: Divide by 3 to find the value of m. m = (24)/(3) m = 8 Now, update the frequency table with m=8: Mass (x): 1, 2, 3, 4, 5 Frequency (f): 3, (8)/(2), 8, 3, 2 Frequency (f): 3, 4, 8, 3, 2 b) Find the Mode, Median, and Mean i) Mode The mode is the value with the highest frequency. The frequencies are 3, 4, 8, 3, 2. The highest frequency is 8, which corresponds to a mass of 3 kg. The mode is 3 kg. ii) Median There are 20 fruits, so the median is the average of the 10^th and 11^th values. Let's list the cumulative frequencies: • Mass 1 kg: 3 fruits (1st to 3rd) • Mass 2 kg: 4 fruits (4th to 7th) • Mass 3 kg: 8 fruits (8th to 15th) • Mass 4 kg: 3 fruits (16th to 18th) • Mass 5 kg: 2 fruits (19th to 20th) The 10^th value falls within the mass 3 kg category. The 11^th value also falls within the mass 3 kg category. The median is (3 + 3)/(2) = 3 kg. iii) Mean The mean is calculated using the formula Mean = ( (x · f))/( f). Step 1: Calculate (x · f). (x · f) = (1 × 3) + (2 × 4) + (3 × 8) + (4 × 3) + (5 × 2) (x · f) = 3 + 8 + 24 + 12 + 10 (x · f) = 57 Step 2: The total frequency f = 20. Step 3: Calculate the mean. Mean = (57)/(20) Mean = 2.85 kg c) Find the probability of picking a fruit that has a mass more than 3 kg Step 1: Identify the fruits with mass more than 3 kg. These are fruits with mass 4 kg and 5 kg. Step 2: Find the total frequency for these masses. Frequency for 4 kg = 3 Frequency for 5 kg = 2 Total fruits with mass > 3 kg = 3 + 2 = 5. Step 3: Calculate the probability. Probability = Number of fruits with mass > 3 kgTotal number of fruits Probability = (5)/(20) Probability = (1)/(4) or 0.25 d) Draw a bar graph for the data To draw a bar graph: • Draw a horizontal axis (x-axis) and label it "Mass (kg)". Mark points for 1, 2, 3, 4, and 5. • Draw a vertical axis (y-axis) and label it "Frequency". Scale it from 0 up to at least 8 (the maximum frequency). • For each mass value, draw a vertical bar with a height corresponding to its frequency: • For Mass 1 kg, draw a bar of height 3. • For Mass 2 kg, draw a bar of height 4. • For Mass 3 kg, draw a bar of height 8. • For Mass 4 kg, draw a bar of height 3. • For Mass 5 kg, draw a bar of height 2. • Ensure the bars are of equal width and typically have small gaps between them. What's next? 📸