

This mathematics problem involves applying core mathematical principles and formulas. Below you will find a complete step-by-step solution with detailed explanations for each step, helping you understand not just the answer but the method behind it.
ScanSolve AI Answer
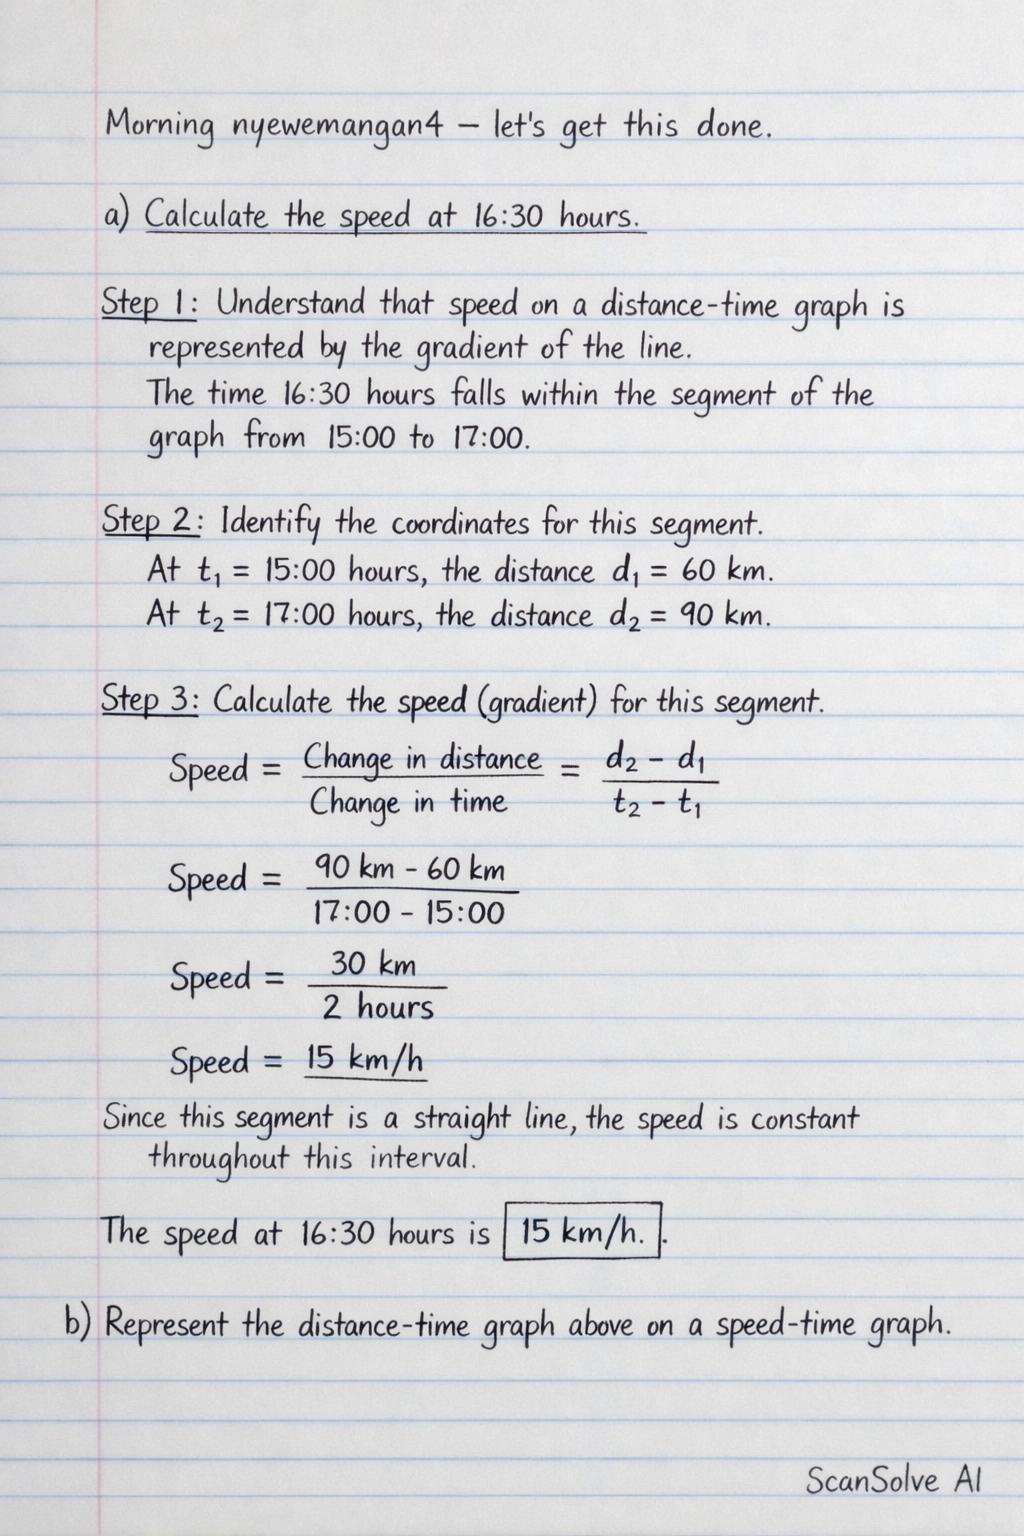
a) Calculate the speed at 16:30 hours. Step 1: Understand that speed on a distance-time graph is represented by the gradient of the line. The time 16:30 hours falls within the segment of the graph from 15:00 to 17:00. Step 2: Identify the coordinates for this segment. At t_1 = 15:00 hours, the distance d_1 = 60 km. At t_2 = 17:00 hours, the distance d_2 = 90 km. Step 3: Calculate the speed (gradient) for this segment. Speed = Change in distanceChange in time = (d_2 - d_1)/(t_2 - t_1) Speed = 90 km - 60 km17:00 - 15:00 Speed = 30 km2 hours Speed = 15 km/h Since this segment is a straight line, the speed is constant throughout this interval. The speed at 16:30 hours is 15 km/h. b) Represent the distance-time graph above on a speed-time graph. Step 1: Analyze the speed for each segment of the distance-time graph. Segment 1 (from 14:00 to 15:00): Time interval = 15:00 - 14:00 = 1 hour. Distance covered = 60 km - 0 km = 60 km. Speed = 60 km1 hour = 60 km/h. Segment 2 (from 15:00 to 17:00): Time interval = 17:00 - 15:00 = 2 hours. Distance covered = 90 km - 60 km = 30 km. Speed = 30 km2 hours = 15 km/h. Step 2: Plot these constant speeds on the speed-time graph. The x-axis of the speed-time graph represents time in hours, starting from 0 (which corresponds to 14:00). From t=0 hours (14:00) to t=1 hour (15:00), the speed is 60 km/h. Draw a horizontal line at 60 km/h from t=0 to t=1. From t=1 hour (15:00) to t=3 hours (17:00), the speed is 15 km/h. Draw a horizontal line at 15 km/h from t=1 to t=3. The speed-time graph will look like this: [scale=0.8] [->] (0,0) -- (4.5,0) node[below] time (hours); [->] (0,0) -- (0,4.5) node[left] speed (km/h); in 0,1,2,3,4 (,0) node[below] ; in 0,20,40,60,80 (0,/20*4) node[left] ; [dashed, gray] (0,1.2) -- (4,1.2); % 15 km/h line [dashed, gray] (0,2.4) -- (4,2.4); % 30 km/h line [dashed, gray] (0,3.6) -- (4,3.6); % 60 km/h line [thick, blue] (0,3.6) -- (1,3.6); % First segment: 60 km/h for 1 hour [thick, blue] (1,0.9) -- (3,0.9); % Second segment: 15 km/h for 2 hours [fill=black] (0,3.6) circle (1.5pt); [fill=black] (1,3.6) circle (1.5pt); [fill=black] (1,0.9) circle (1.5pt); [fill=black] (3,0.9) circle (1.5pt); The graph should show a horizontal line at 60 km/h from t=0 to t=1 hour, and another horizontal line at 15 km/h from t=1 to t=3 hours.