
We read your photo as:
The distribution of Junior workers is as follow: Clerks - 78, Drivers - 36, Typists - 44, Messengers - 52, other - 30. Represent the above information by a pie chart. b. The table below show the frequency distribution of marks scored by 30 Candidates in a operate test.
Mathematics
ScanSolve AI Answer
Step-by-step solution
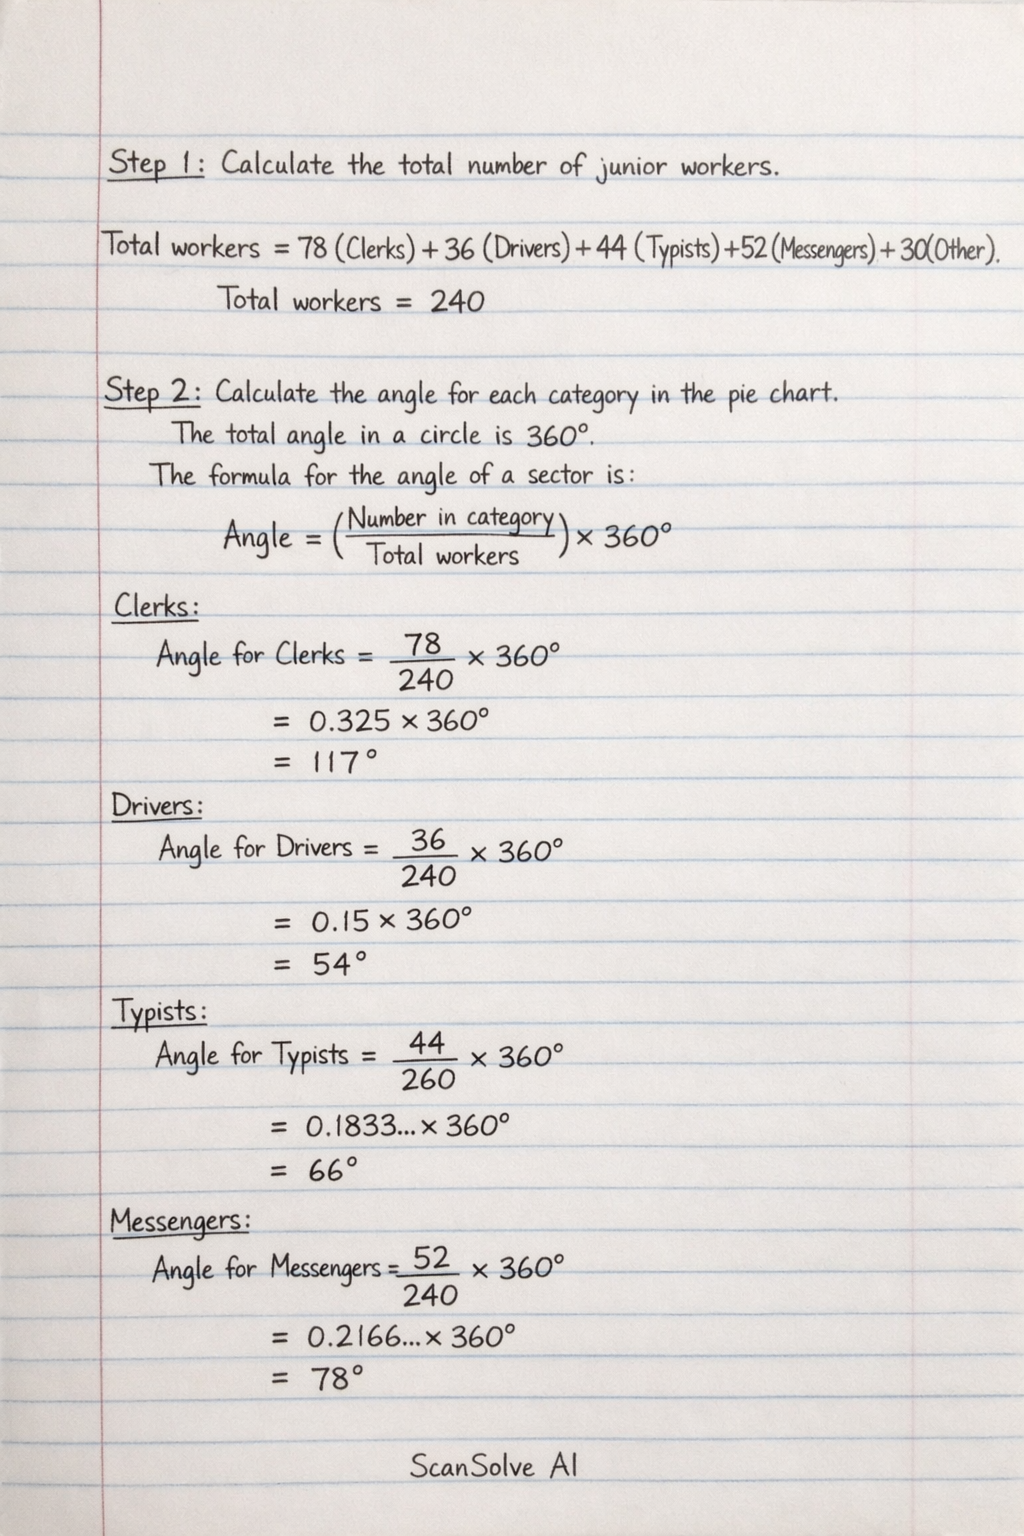
3 stepsCalculate the total number of junior workers.
Calculate the angle for each category in the pie chart.
The total angle in a circle is .
The formula for the angle of a sector is:- Clerks:
- Drivers:
- Typists:
- Messengers:
- Other:
Summarize the angles for the pie chart.
- Clerks:
- Drivers:
- Typists:
- Messengers:
- Other:
These angles sum to .
Was this helpful?
Still stuck on this one?
Ask a follow-up, and the answer starts from this question.
Got a different question?Ask your own question
More Mathematics Questions
QTable 2.2: Scores of candidates. Prepare a cumulative frequency table and draw the cumulative…QThe following is record of scores obtained 30 J.H.S. 2 pupils in a test marked out of 5: 5, 4, 3, 1…QConstruct a frequency distribution table for the marks obtained by 30 students recorded belowQThe table below shows the marks obtained by 278 candidates in an examination. a) State the modal…QPrepare a frequency distribution table for the given marks using exclusive class intervals. The…
Browse by topic:Statistics
Handwritten Step-by-Step Solution
Get this as a handwritten image on WhatsApp — like a tutor wrote it for you.
Try on WhatsApp