
We read your photo as:
The following is record of scores obtained 30 J.H.S. 2 pupils in a test marked out of 5: 5, 4, 3, 1, 3, 3, 4, 2, 3, 4, 3, 1 2, 3, 3, 2, 1 A. Construct a frequency table for the data. B. Find the median marks. C. Calculate the mean of the distribution
ScanSolve AI Answer
Step-by-step solution
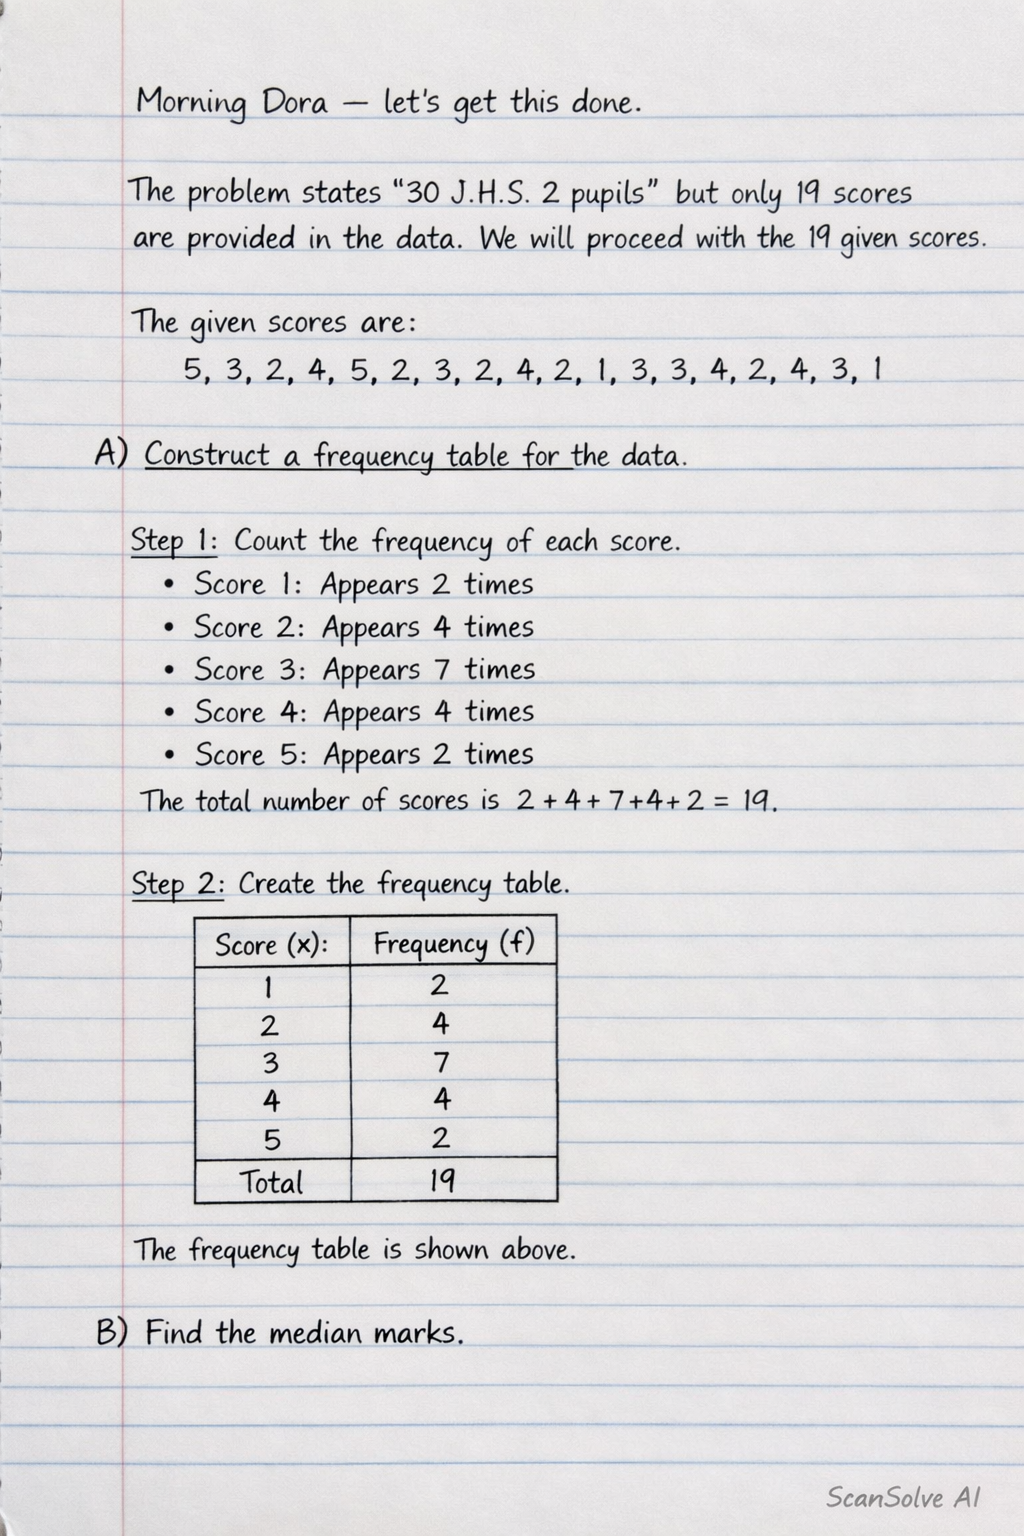
6 stepsThe problem states "30 J.H.S. 2 pupils" but only 19 scores are provided in the data. We will proceed with the 19 given scores.
The given scores are:
$5, 3, 2, 4, 5, 2, 3, 3, 4, 2, 1, 3, 3, 4, 2, 3, 4, 3, 1$
A) Construct a frequency table for the data.
Count the frequency of each score.
- Score 1: Appears 2 times
- Score 2: Appears 4 times
- Score 3: Appears 7 times
- Score 4: Appears 4 times
- Score 5: Appears 2 times The total number of scores is .
Create the frequency table.
The frequency table is shown above.
B) Find the median marks.
Determine the position of the median.
Since the total number of scores () is 19 (an odd number), the median is the value at the position.
The median is the 10th score when the data is arranged in ascending order.
Find the 10th score.
Let's list the scores in ascending order using the frequency table:
(2 scores)
(next 4 scores, cumulative total: scores)
(next 7 scores, cumulative total: scores)
The 10th score falls within the group of scores that are 3. Specifically, the 7th score is 3, the 8th is 3, the 9th is 3, and the 10th score is 3.The median mark is .
C) Calculate the mean of the distribution.
Calculate the sum of (score frequency) for all scores.
We add an column to the frequency table:
Calculate the mean using the formula .
The mean of the distribution is .
Still stuck on this one?
Ask a follow-up, and the answer starts from this question.
More Mathematics Questions
Handwritten Step-by-Step Solution
Get this as a handwritten image on WhatsApp — like a tutor wrote it for you.
Try on WhatsApp