
We read your photo as:
The figures in the table below are the ages, to the nearest year, of a random sample of 30 people negotiating a mortgage in a bank. Use the data below to answer the questions that follow.
ScanSolve AI Answer
Step-by-step solution
9 stepsQuestion 1
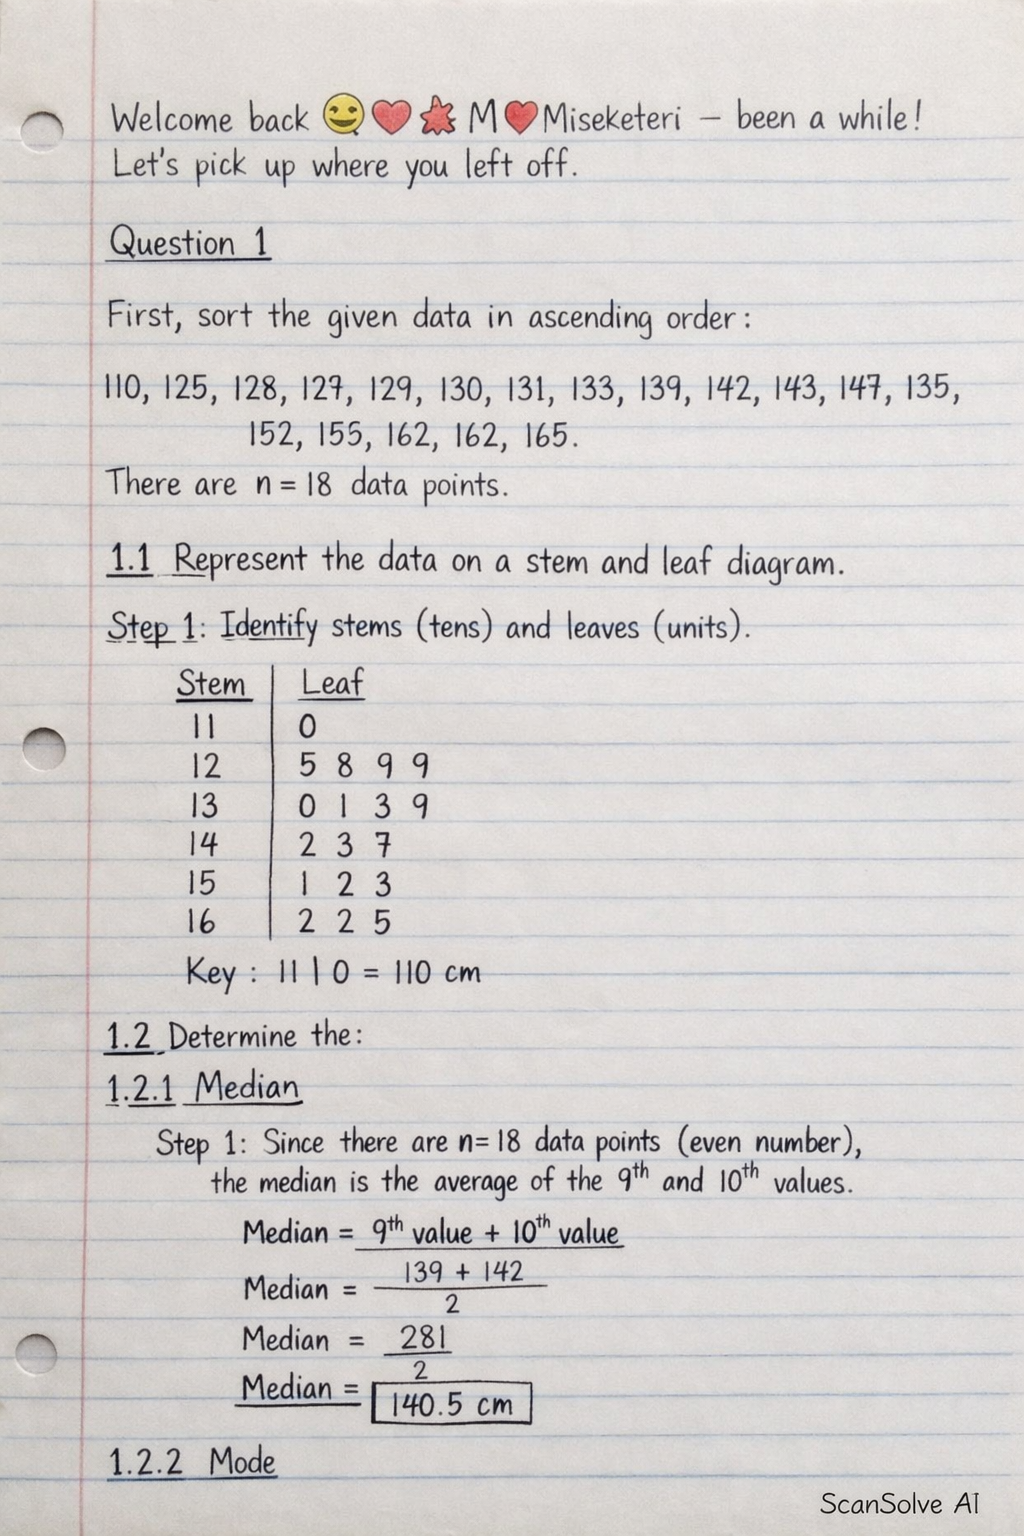
First, sort the given data in ascending order:
.
There are data points.
1.1 Represent the data on a stem and leaf diagram.
Identify stems (tens and hundreds digits) and leaves (units digits).
Key:
1.2 Determine the:
1.2.1 Median
Since there are data points (an even number), the median is the average of the and values.
The median is the average of the and values.
1.2.2 Mode
Identify the value(s) that appear most frequently in the data set.
The values 129 and 162 each appear twice, which is more than any other value.
1.2.3 Lower quartile and the upper quartile
Calculate the lower quartile ().
This is the median of the lower half of the data.
The lower half consists of the first 9 values: .
is the value of this lower half.Calculate the upper quartile ().
This is the median of the upper half of the data.
The upper half consists of the last 9 values: .
is the value of this upper half.1.2.4 Mean
Sum all the data values.
Divide the sum by the number of data points ().
Question 2
The given data for ages are:
.
There are data points.2.1 Complete the frequency table.
Tally the data for each age interval.
- For : (10 values)
- For : (13 values)
- For : (4 values)
- For : (3 values)
Fill in the frequency table.
2.2 Use the information from the frequency table to draw a histogram.
2.3 Draw a frequency polygon on the grid provided in the SPECIAL ANSWER SHEET.
These parts require a special answer sheet with a grid, which is not provided here. Therefore, these cannot be completed in this format.
Still stuck on this one?
Ask a follow-up, and the answer starts from this question.
More Mathematics Questions
Handwritten Step-by-Step Solution
Get this as a handwritten image on WhatsApp — like a tutor wrote it for you.
Try on WhatsApp