
We read your photo as:
The graph below shows a patient's temperature recorded at intervals of 2 hours from 8am to 4pm. Use it to answer the questions.
Mathematics
ScanSolve AI Answer
Answers
3 partsStep-by-step solution
4 stepsHapa kuna majibu kwa maswali yako:
Part a
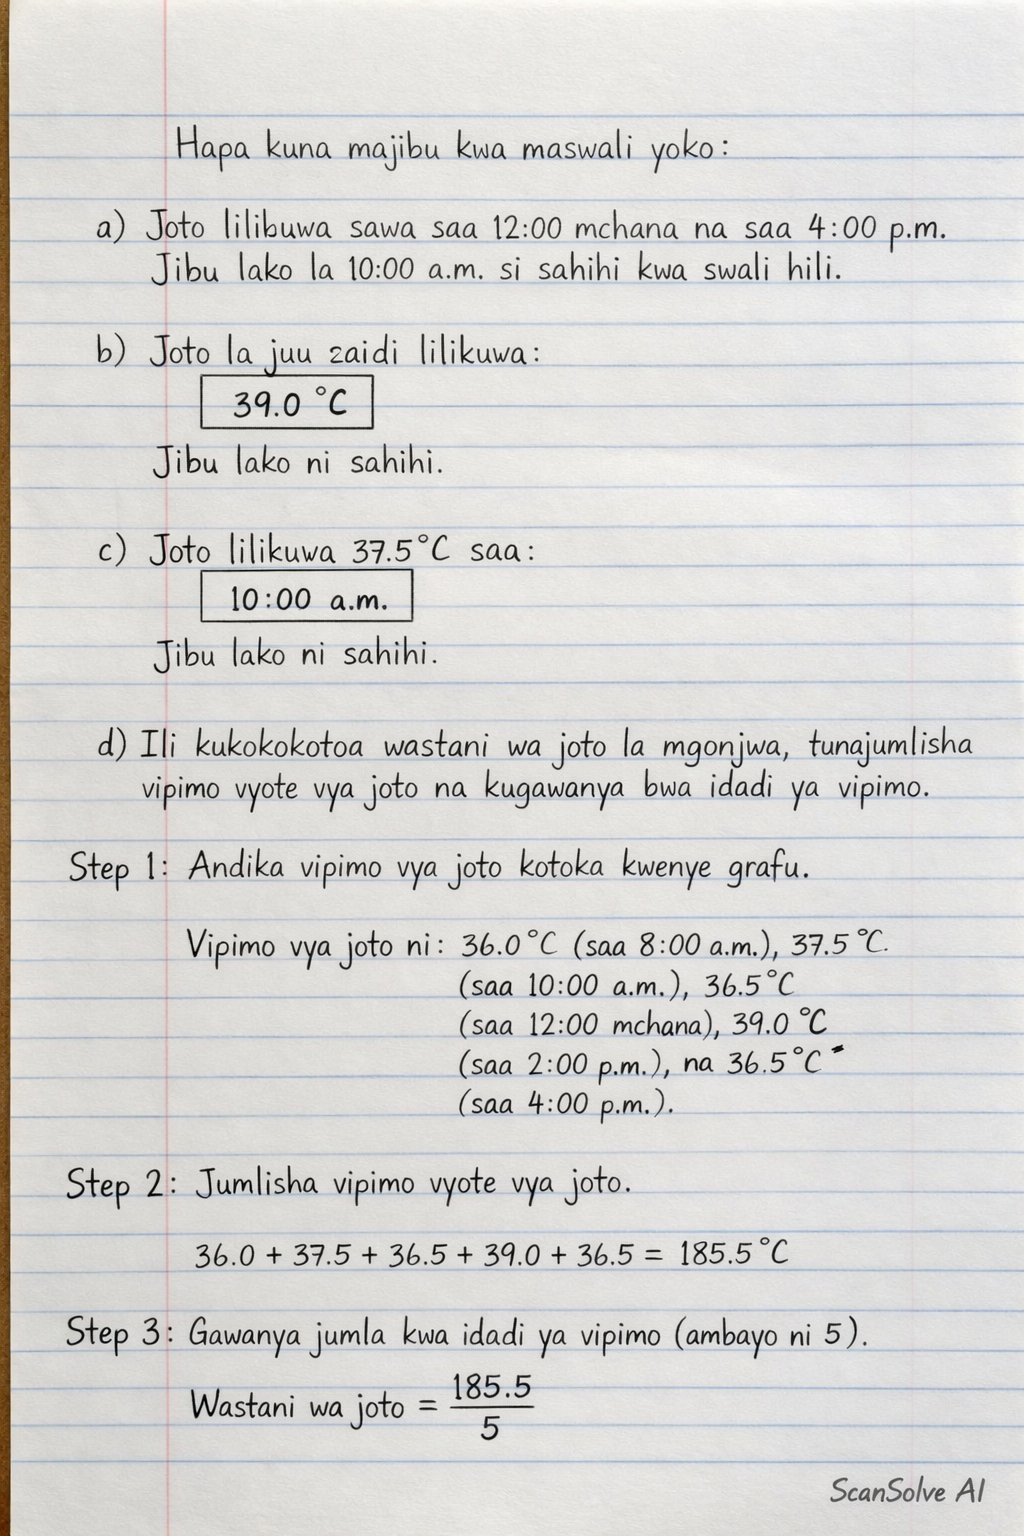
Joto lilikuwa sawa saa 12:00 mchana na saa 4:00 p.m.
Jibu lako la 10:00 a.m. si sahihi kwa swali hili.
Part b
Joto la juu zaidi lilikuwa
Jibu lako ni sahihi.
Part c
Joto lilikuwa 37.5°C saa
Jibu lako ni sahihi.
Part d
Ili kukokotoa wastani wa joto la mgonjwa, tunajumlisha vipimo vyote vya joto na kugawanya kwa idadi ya vipimo.
Andika vipimo vya joto kutoka kwenye grafu.
Vipimo vya joto ni: (saa 8:00 a.m.), (saa 10:00 a.m.), (saa 12:00 mchana), (saa 2:00 p.m.), na (saa 4:00 p.m.).
Jumlisha vipimo vyote vya joto.
Gawanya jumla kwa idadi ya vipimo (ambayo ni 5).
Kokotoa wastani.
Wastani wa joto la mgonjwa ni:
Was this helpful?
Try one yourself
A new problem that tests the same skill.
Still stuck on this one?
Ask a follow-up, and the answer starts from this question.
Got a different question?Ask your own question
More Mathematics Questions
QPlease fill out the 4-hour chart with patient information, including Name, Age, Sex, Ward, Hospital…QUsing the provided table of temperature and time, plot a graph of temperature against time and…QPlot a graph of temperature against time and determine the temperature change.QOn the grid provided, plot a graph of temperature (vertical axis) against time.QStudy the graph below and answer the questions that follow.
Handwritten Step-by-Step Solution
Get this as a handwritten image on WhatsApp — like a tutor wrote it for you.
Try on WhatsApp