
We read your photo as:
The table gives the frequency distribution of marks obtained by a number of students in a test. If the mean mark is 5, calculate the: (a) the value of m; (b) median; (c) standard deviation of the distribution.
ScanSolve AI Answer
Answers
3 partsStep-by-step solution
11 stepsHere's how to solve the problem:
Part a· 4 steps
The value of ;
Write down the formula for the mean.
The mean () is given by the sum of (mark frequency) divided by the sum of frequencies.
Calculate the sum of .
Calculate the sum of frequencies.
Substitute the sums and the given mean () into the formula and solve for .
Multiply both sides by :
Subtract from both sides:
The value of is .
Part b
Median;
Update the frequency table with .
Marks () Frequency () Cumulative Frequency (CF) 3 5 5 4 10 5 6 9 7 4 8 1 Calculate the total number of students ().
Determine the position of the median.
For discrete data, the median is at the -th position.
This means the median is the average of the 20th and 21st values.
Locate the median mark using the cumulative frequency.
From the cumulative frequency column, the 20th value falls within the mark 5 category (since CF for mark 4 is 15, and CF for mark 5 is 26). The 21st value also falls within the mark 5 category.
Therefore, the median is 5.
The median is .
Part c
Standard deviation of the distribution.
Write down the formula for standard deviation.
The standard deviation () for grouped data is given by:
We know and .
Calculate .
Marks () Frequency () 3 5 9 4 10 16 5 11 25 6 9 36 7 4 49 8 1 64 Total 40 1064 So, . Substitute the values into the standard deviation formula.
Rounding to three decimal places:
The standard deviation is .
Try one yourself
A new problem that tests the same skill.
Still stuck on this one?
Ask a follow-up, and the answer starts from this question.
More Mathematics Questions
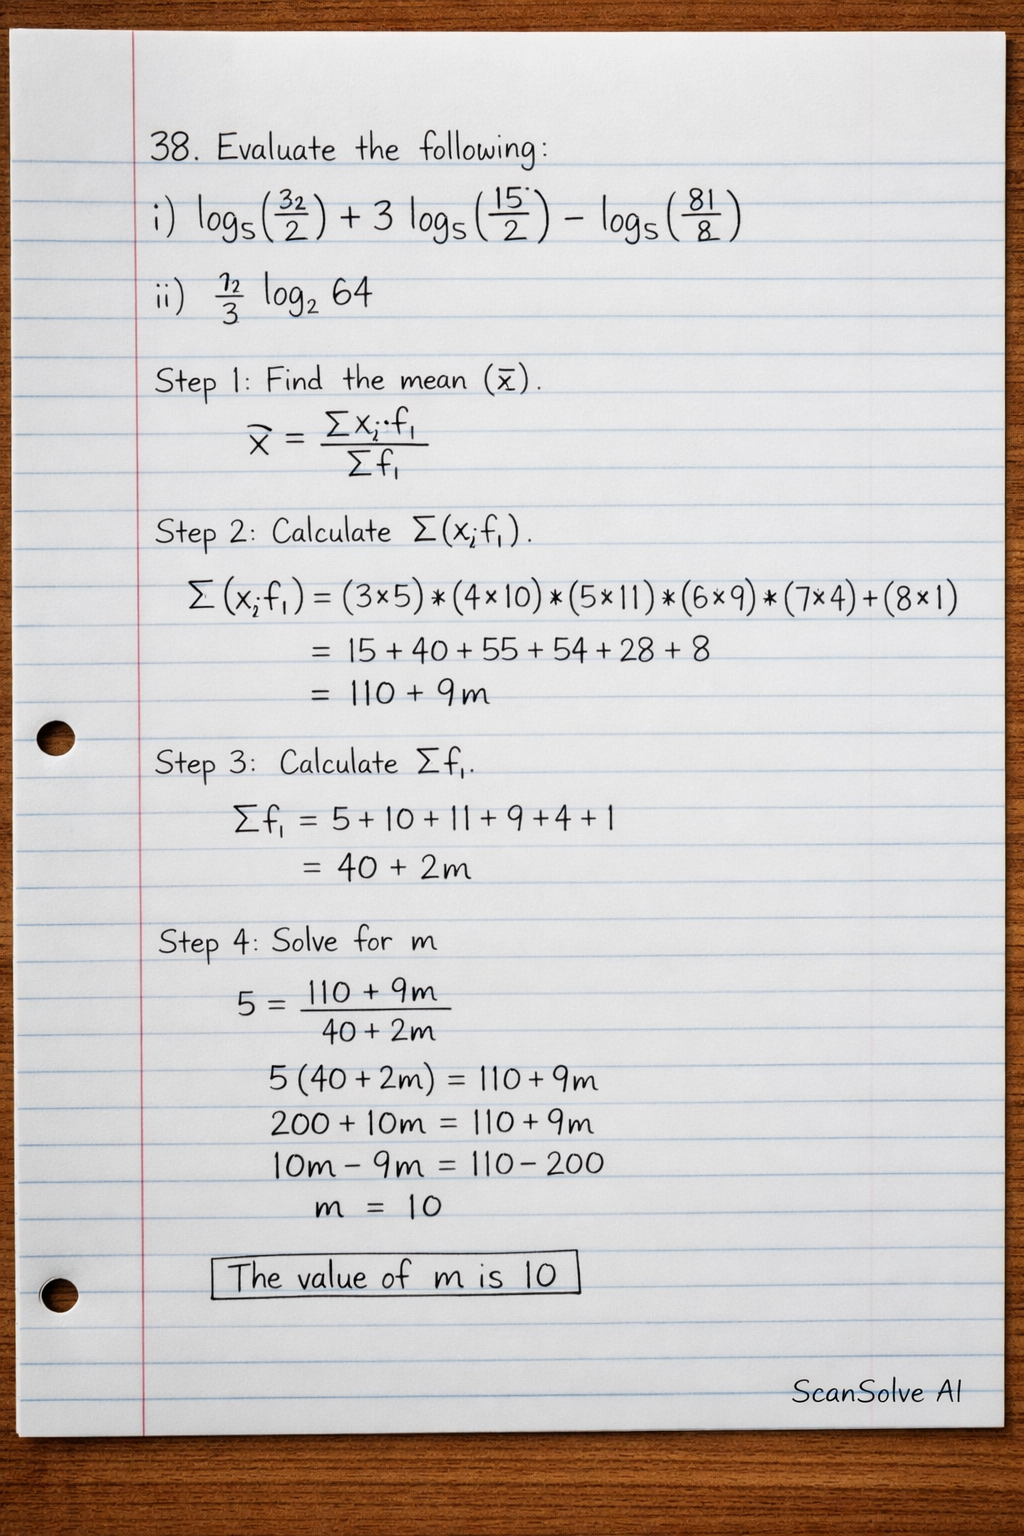
Handwritten Step-by-Step Solution
Get this as a handwritten image on WhatsApp — like a tutor wrote it for you.
Try on WhatsApp