
We read your photo as:
Using set theory, represent the given voter information. Show this information in a Venn diagram.
ScanSolve AI Answer
Answers
2 partsHere's the solution to question 4:
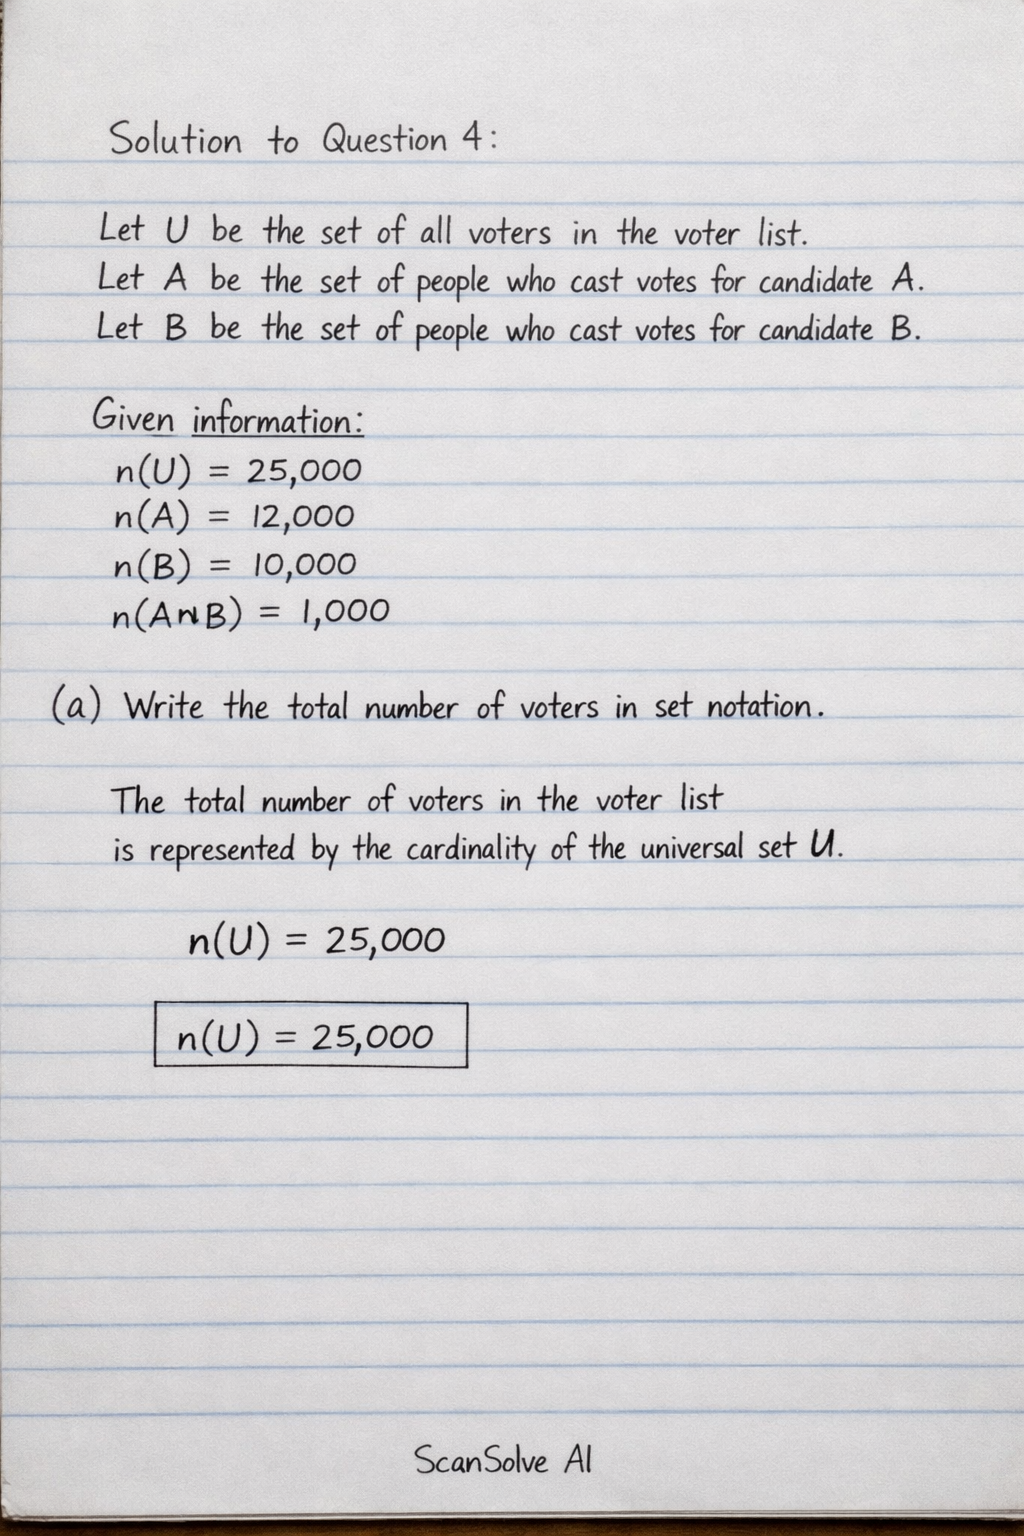
Let be the set of all voters in the voter list.
Let be the set of people who cast votes for candidate A.
Let be the set of people who cast votes for candidate B.
Given information:
- Total voters in the voter list, .
- People who cast votes for A, .
- People who cast votes for B, .
- People who cast votes for both A and B, .
a) Write the total number of voters in set notation.
The total number of voters in the voter list is represented by the cardinality of the universal set .
b) Show this information in a Venn diagram.
First, calculate the number of people in each region of the Venn diagram:
- Number of people who voted for A only:
- Number of people who voted for B only:
- Number of people who voted for at least one candidate (A or B or both): (Alternatively, )
- Number of people who did not cast any vote:
Venn Diagram Description:
- Draw a rectangle representing the universal set with .
- Inside the rectangle, draw two overlapping circles. Label one circle and the other .
- In the overlapping region (intersection ), write 1,000.
- In the part of circle that does not overlap with (A only), write 11,000.
- In the part of circle that does not overlap with (B only), write 9,000.
- Outside both circles but inside the rectangle, write 4,000.
c) How many people didn't cast vote? Find it.
The number of people who didn't cast a vote is the total number of voters minus those who voted for at least one candidate.
The final answer is .
d) Compare the valid vote and invalid vote.
Try one yourself
A new problem that tests the same skill.
Still stuck on this one?
Ask a follow-up, and the answer starts from this question.
More Mathematics Questions
Handwritten Step-by-Step Solution
Get this as a handwritten image on WhatsApp — like a tutor wrote it for you.
Try on WhatsApp