
We read your photo as:
Using the data's range and scope, create a graph. What is the meaning of frequency?
Mathematics
ScanSolve AI Answer
Step-by-step solution
3 stepsለ) የመረጃዎቹን ወሰን እና የጊዜ ስፋት በመጠቀም ስዕላዊ መግለጫ ስሩ።
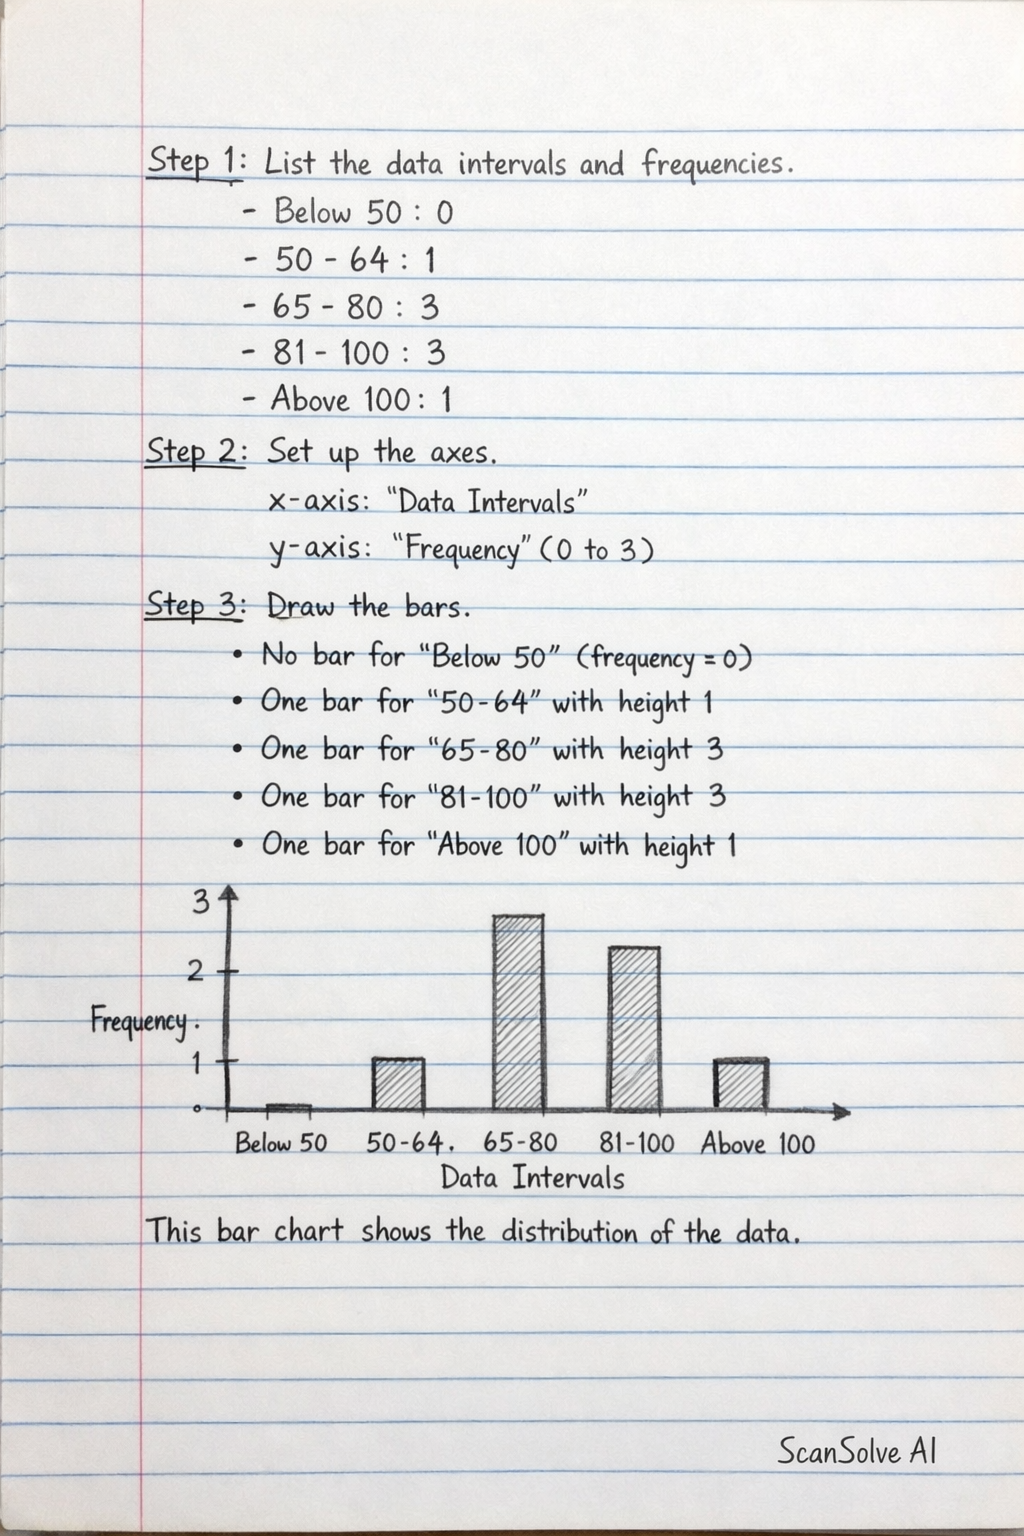
የተሰጡትን ክፍሎች እና ድግግሞሾችን በመጠቀም የባር ገበታ (Bar Chart) እንሰራለን።
የመረጃ ክፍሎችን እና ድግግሞሾችን መለየት።
- ከ50 በታች: 0
- ከ50 እስከ 64: 1
- ከ65 እስከ 80: 3
- ከ81 እስከ 100: 3
- ከ100 በላይ: 1
የገበታውን መጥረቢያዎች ማዘጋጀት።
- አግድም መጥረቢያ (x-axis): የቁጥሮች ክፍሎችን ይወክላል። "የቁጥሮች ክፍሎች" ብለን እንሰይመዋለን።
- ቀጥ ያለ መጥረቢያ (y-axis): ድግግሞሽን ይወክላል። "ድግግሞሽ" ብለን እንሰይመዋለን። የዚህ መጥረቢያ ልኬት ከ0 እስከ 3 (ከፍተኛው ድግግሞሽ) መሆን አለበት።
ለእያንዳንዱ ክፍል ባር መሳል።
- ለክፍል "ከ50 በታች" ድግግሞሹ 0 ስለሆነ ባር አይሳልም።
- ለክፍል "ከ50 እስከ 64"፣ ከ50 እስከ 64 ባለው ስፋት እና 1 ከፍታ ያለው ባር ይሳሉ።
- ለክፍል "ከ65 እስከ 80"፣ ከ65 እስከ 80 ባለው ስፋት እና 3 ከፍታ ያለው ባር ይሳሉ።
- ለክፍል "ከ81 እስከ 100"፣ ከ81 እስከ 100 ባለው ስፋት እና 3 ከፍታ ያለው ባር ይሳሉ።
- ለክፍል "ከ100 በላይ"፣ ከ100 ጀምሮ ወደ ላይ የሚሄድ (ለምሳሌ እስከ 170 ድረስ) እና 1 ከፍታ ያለው ባር ይሳሉ።
ይህ ገበታ የቁጥሮቹን ስርጭት በእይታ ያሳያል።
ሐ) ድግግሞሽ ትርጉሙ።
ድግግሞሽ (Frequency) ማለት በአ
Was this helpful?
Still stuck on this one?
Ask a follow-up, and the answer starts from this question.
Got a different question?Ask your own question
More Mathematics Questions
QThe number of times a particular data value occurs is known as the frequency. A frequency table is…QPlot a graph of the inverse of mean against frequencyQGraph of inverse of mean against frequencyQRepresent the above data in a frequency table.QDraw the cumulative frequency curve using the provided data.
Handwritten Step-by-Step Solution
Get this as a handwritten image on WhatsApp — like a tutor wrote it for you.
Try on WhatsApp