
This mathematics problem involves applying core mathematical principles and formulas. Below you will find a complete step-by-step solution with detailed explanations for each step, helping you understand not just the answer but the method behind it.
ScanSolve AI Answer
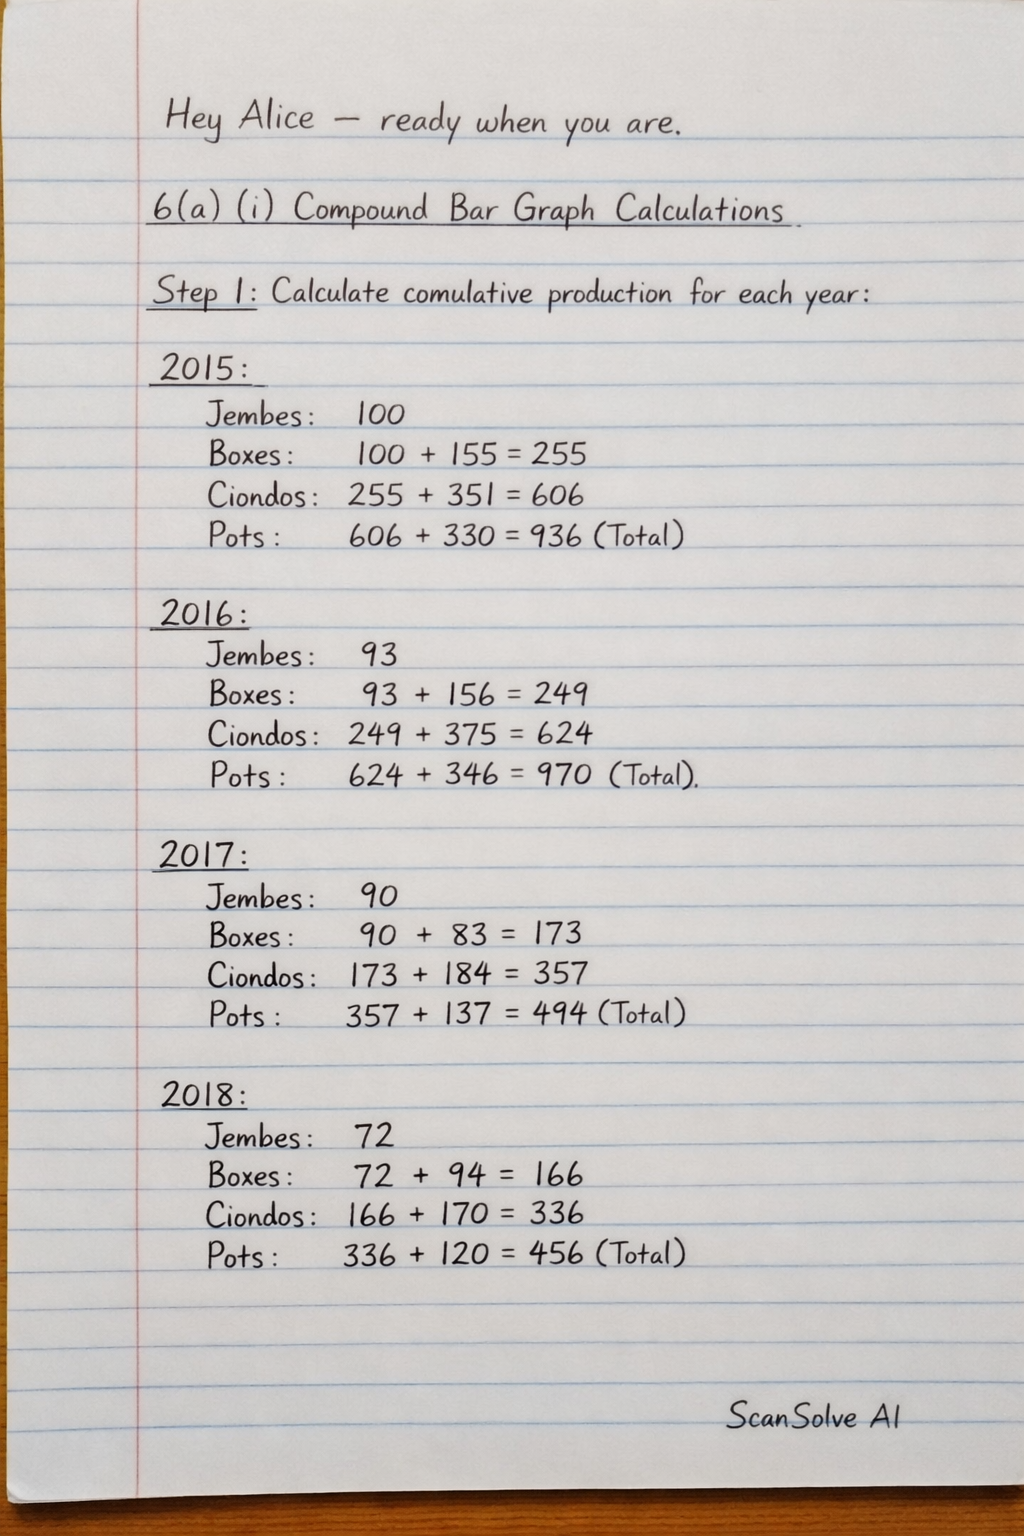
Hey Alice — ready when you are. 6(a) (i) Compound Bar Graph Calculations To draw a compound bar graph, we need to calculate the cumulative production for each year. The scale is 1 cm for 100,000 items. Since the table values are already in '000s, each unit in the table directly corresponds to 1 cm on the graph. Step 1: Calculate cumulative production for each year. 2015: Jembes: 100 Boxes: 100 + 155 = 255 Ciondos: 255 + 351 = 606 Pots: 606 + 330 = 936 (Total) 2016: Jembes: 93 Boxes: 93 + 156 = 249 Ciondos: 249 + 375 = 624 Pots: 624 + 346 = 970 (Total) 2017: Jembes: 90 Boxes: 90 + 83 = 173 Ciondos: 173 + 184 = 357 Pots: 357 + 137 = 494 (Total) 2018: Jembes: 72 Boxes: 72 + 94 = 166 Ciondos: 166 + 170 = 336 Pots: 336 + 120 = 456 (Total) Step 2: Describe how to draw the graph. Draw a horizontal axis (X-axis) for the years (2015, 2016, 2017, 2018). Draw a vertical axis (Y-axis) for the number of items produced (in '000s). Label the Y-axis "Production ('000 items)" and mark it with a scale where 1 cm represents 100,000 items (or 100 units on your graph paper). For each year, draw a bar whose total height corresponds to the total production for that year (e.g., 936 cm for 2015, 970 cm for 2016, etc., if using a very large paper, or 9.36 cm for 2015 if 1 cm represents 100 units). Divide each bar into segments based on the cumulative values calculated above. For example, for 2015: The first segment (Jembes) goes from 0 to 100. The second segment (Boxes) goes from 100 to 255. The third segment (Ciondos) goes from 255 to 606. The fourth segment (Pots) goes from 606 to 936. Use different patterns or colors for each item type (Jembes, Boxes, Ciondos, Pots) and include a key or legend* to explain them. Give the graph a suitable title, e.g., "Compound Bar Graph Showing Production of Items in Jua Kali Industry (2015-2018)". 6(a) (ii) Other appropriate methods to present the data: Pie chart* (or Divided Circles) Proportional circles* Stacked area graph* 6(b) (i) Areas in India where cottage industries are located: Rural areas* throughout India. Specific regions known for handicrafts, e.g., Kashmir (shawls, carpets), Rajasthan (textiles, pottery), Uttar Pradesh (brassware, embroidery), Tamil Nadu* (silk, weaving). 6(b) (ii) Characteristics of cottage industries in India: Small-scale production*, often carried out in homes. Family labor* is predominantly used. Reliance on local raw materials*. Use of simple tools and traditional techniques*. Low capital investment*. Production often caters to local markets* or specific craft niches. 6(c) (i) Two types of industries found in the Ruhr region other than Iron and Steel: Coal mining* Chemical industry* Machinery manufacturing* Textile industry* 6(c) (ii) Four factors that influenced the location of iron and steel industry in the Ruhr region of Germany: Proximity to extensive coal deposits*: The Ruhr region had vast reserves of high-quality coking coal, a primary raw material and fuel for iron and steel production. Excellent transport network*: The Rhine River provided cheap water transport for importing iron ore (from Sweden and France) and exporting finished products. A dense rail network further facilitated distribution. Availability of skilled and unskilled labor*: The densely populated region provided a large workforce necessary for the labor-intensive iron and steel industry. Large market*: The industrialization of Europe created a huge demand for iron and steel, with the Ruhr region being centrally located to serve this market. Water supply*: The Rhine River and its tributaries provided ample water for cooling and various industrial processes. Capital availability*: Early industrial development led to the accumulation of capital, which was reinvested into expanding the iron and steel industry. Send me the next one 📸