
We read your photo as:
Using the provided dataset, construct a frequency distribution table, identify the modal score, and calculate the probability of a student scoring more than 5 marks.
ScanSolve AI Answer
Answers
2 partsStep-by-step solution
5 stepsHere is the solution to question 10:
First, let's list all the given data points and sort them in ascending order:
Data: 0, 0, 1, 2, 2, 2, 3, 4, 5, 5, 5, 5, 5, 6, 6, 6, 6, 6, 6, 7, 7, 7, 7, 8, 8, 9, 9, 9, 10
Total number of students () = 29.
Part a· 1 step
To construct a frequency distribution table, we count how many times each score appears.
Construct the frequency distribution table.
Part b(i)
To state the modal score, we find the score with the highest frequency.
Identify the modal score.
From the frequency table, the highest frequency is 6, which corresponds to the score of 6.
The modal score is .
Part b(ii)
To calculate the probability that a student scored more than 5 marks, we count the number of students who scored 6, 7, 8, 9, or 10, and divide by the total number of students.
Calculate the probability of scoring more than 5 marks.
Number of students who scored more than 5 marks = (Frequency of 6) + (Frequency of 7) + (Frequency of 8) + (Frequency of 9) + (Frequency of 10)
Number of students who scored more than 5 marks =
Total number of students = 29
Probability =
The probability is .c) To calculate the arithmetic mean using an assumed mean of 6, we use the formula , where is the assumed mean, is the frequency, and is the deviation.
Calculate the deviations () and values.
Assumed mean () = 6.
Calculate the arithmetic mean.
The arithmetic mean score is approximately .
Try one yourself
A new problem that tests the same skill.
Still stuck on this one?
Ask a follow-up, and the answer starts from this question.
More Mathematics Questions
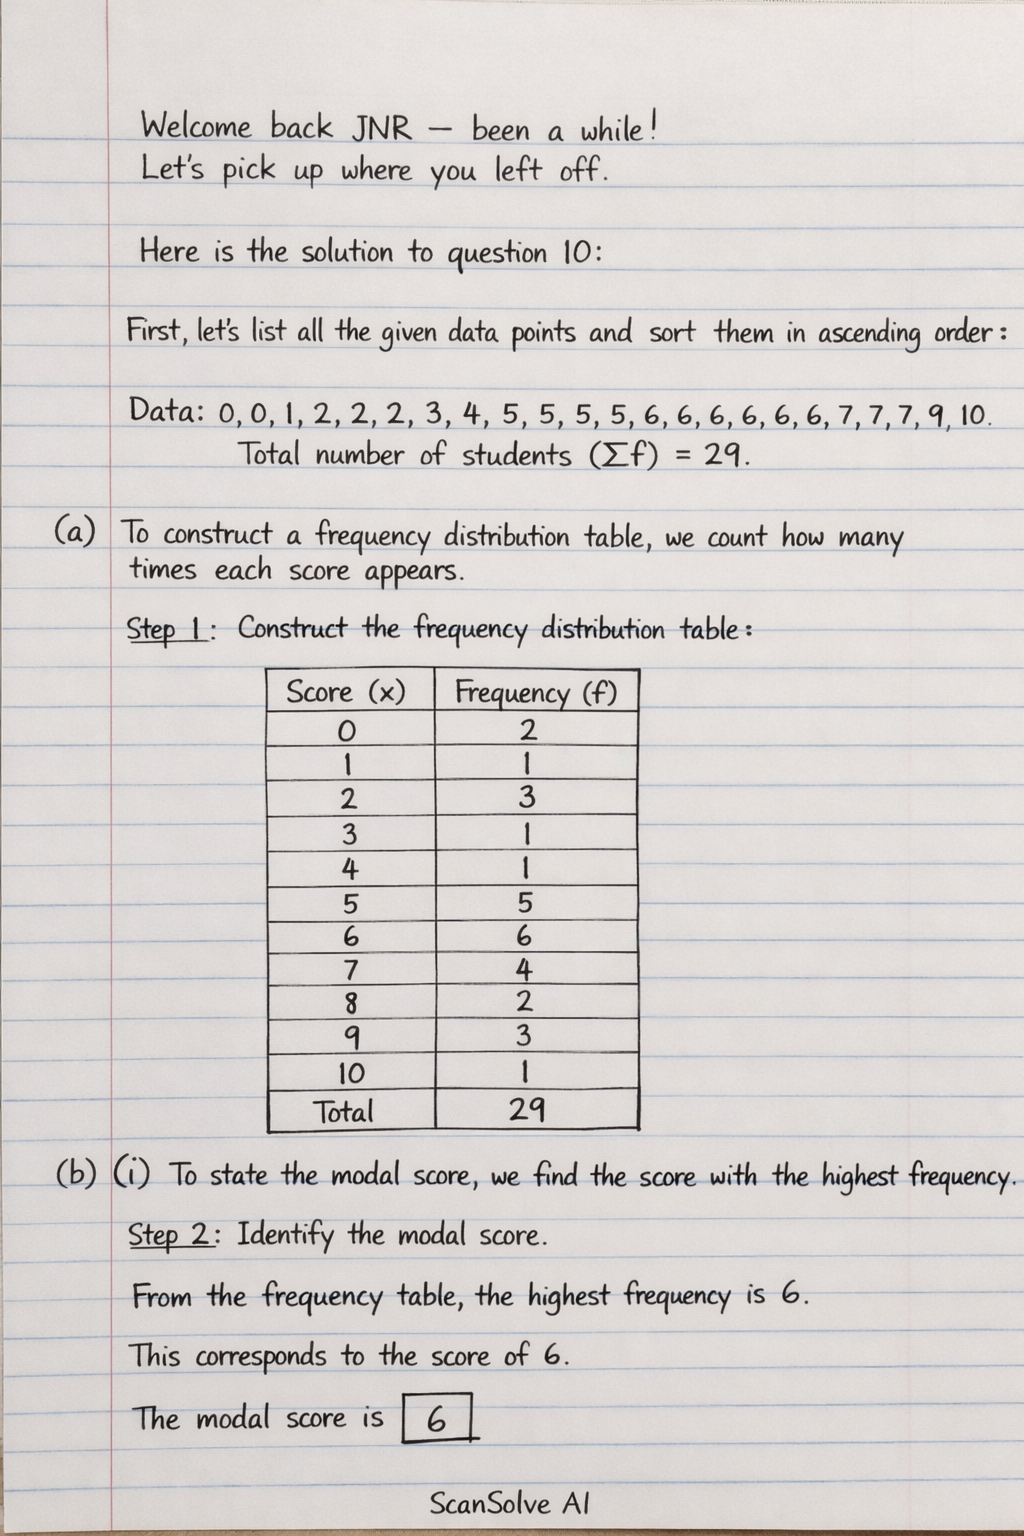
Handwritten Step-by-Step Solution
Get this as a handwritten image on WhatsApp — like a tutor wrote it for you.
Try on WhatsApp