
This mathematics problem involves applying core mathematical principles and formulas. Below you will find a complete step-by-step solution with detailed explanations for each step, helping you understand not just the answer but the method behind it.
ScanSolve AI Answer
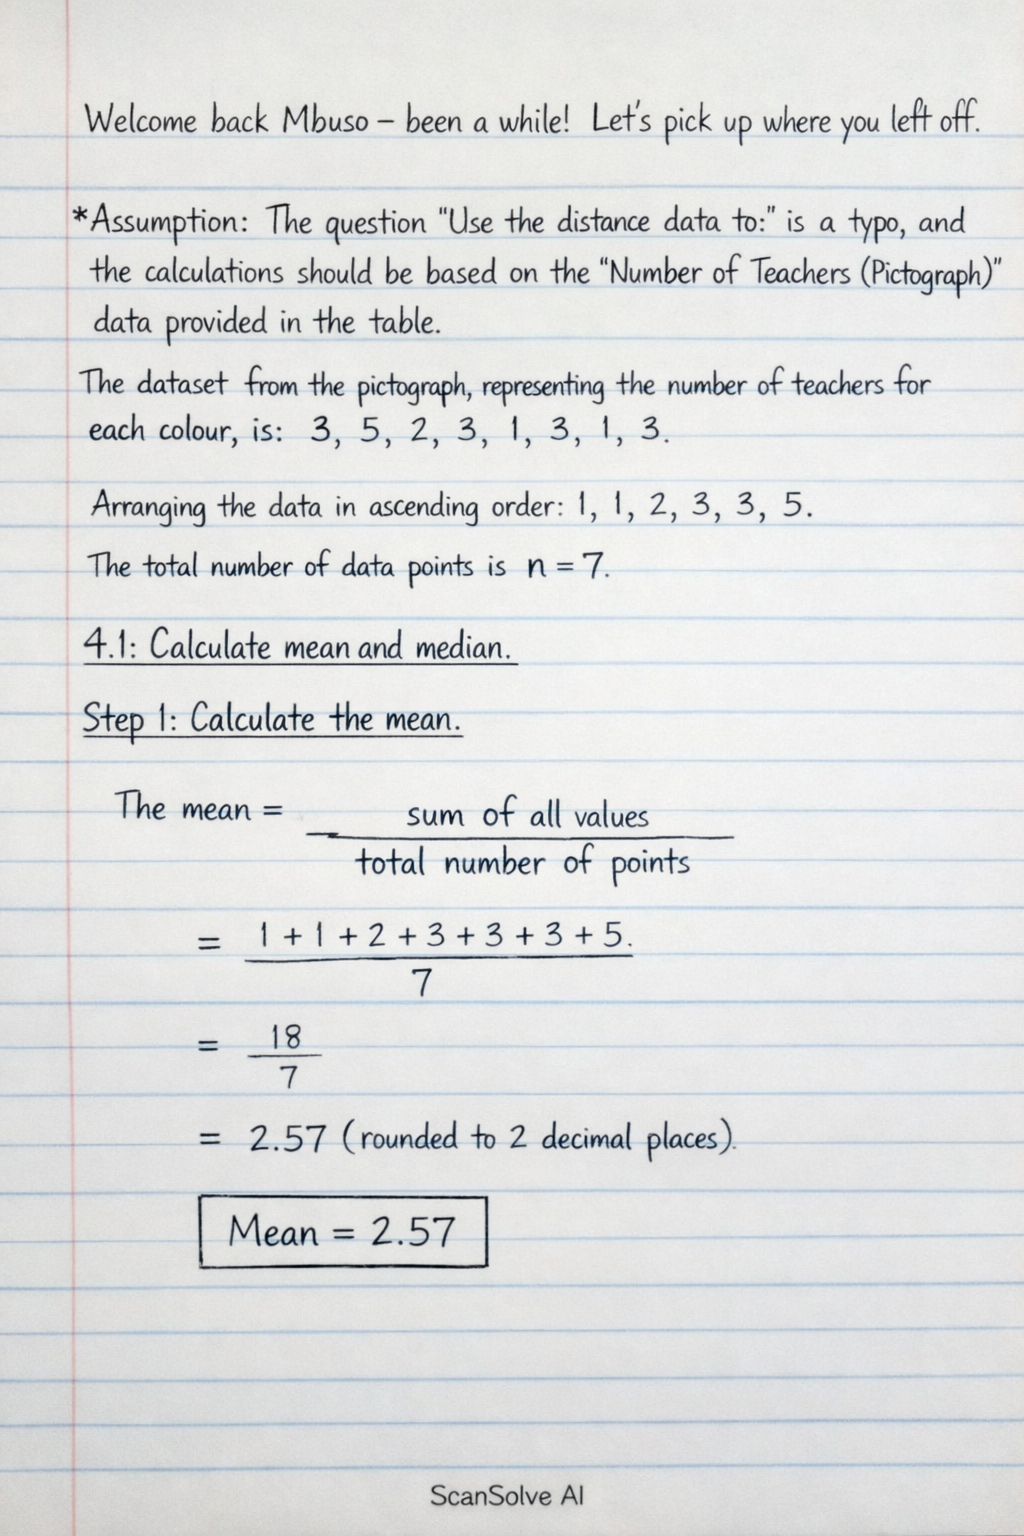
Welcome back Mbuso — been a while! Let's pick up where you left off. Assumption: The question "Use the distance data to:" is a typo, and the calculations should be based on the "Number of Teachers (Pictograph)" data provided in the table. The dataset from the pictograph, representing the number of teachers for each colour, is: 3, 5, 2, 3, 1, 3, 1. Arranging the data in ascending order: 1, 1, 2, 3, 3, 3, 5. The total number of data points is n=7. 4.1 Calculate mean and median. Step 1: Calculate the mean. The mean