This mathematics problem involves applying core mathematical principles and formulas. Below you will find a complete step-by-step solution with detailed explanations for each step, helping you understand not just the answer but the method behind it.
ScanSolve AI Answer
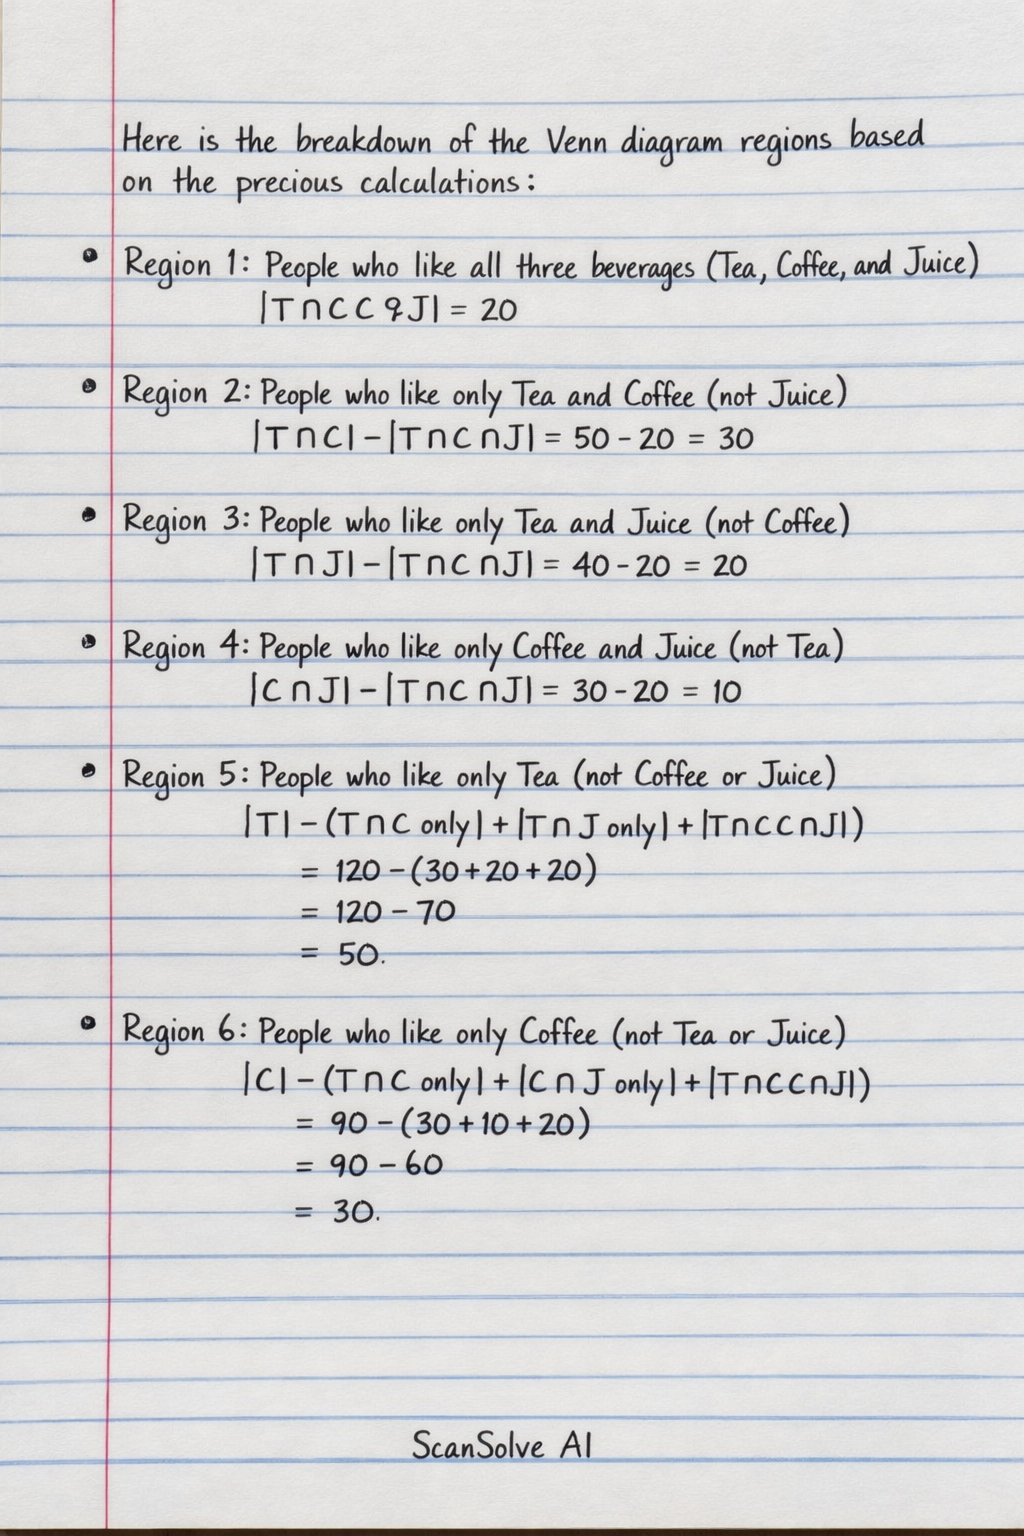
Here is the breakdown of the Venn diagram regions based on the previous calculations: Region 1: People who like all three beverages (Tea, Coffee, and Juice) |T C J| = 20 Region 2: People who like only Tea and Coffee (not Juice) |T C| - |T C J| = 50 - 20 = 30 Region 3: People who like only Tea and Juice (not Coffee) |T J| - |T C J| = 40 - 20 = 20 Region 4: People who like only Coffee and Juice (not Tea) |C J| - |T C J| = 30 - 20 = 10 Region 5: People who like only Tea (not Coffee or Juice) |T| - (|T C only| + |T J only| + |T C J|) = 120 - (30 + 20 + 20) = 120 - 70 = 50 Region 6: People who like only Coffee (not Tea or Juice) |C| - (|T C only| + |C J only| + |T C J|) = 90 - (30 + 10 + 20) = 90 - 60 = 30 Region 7: People who like only Juice (not Tea or Coffee) |J| - (|T J only| + |C J only| + |T C J|) = 70 - (20 + 10 + 20) = 70 - 50 = 20 Region 8: People who do not like any of the beverages (outside all circles) Total people - |T C J| = 200 - 180 = 20 To summarize the regions for a Venn diagram: Center (T ∩ C ∩ J): 20 T and C only: 30 T and J only: 20 C and J only: 10 T only: 50 C only: 30 J only: 20 Outside all circles: 20 That's 2 down. 3 left today — send the next one.