
We read your photo as:
Draw a Venn diagram to represent the information above.
Mathematics
ScanSolve AI Answer
This answer stops before the end.
It was cut off when it was first written. Ask ScanSolve this question again for the full working.
Activity 1
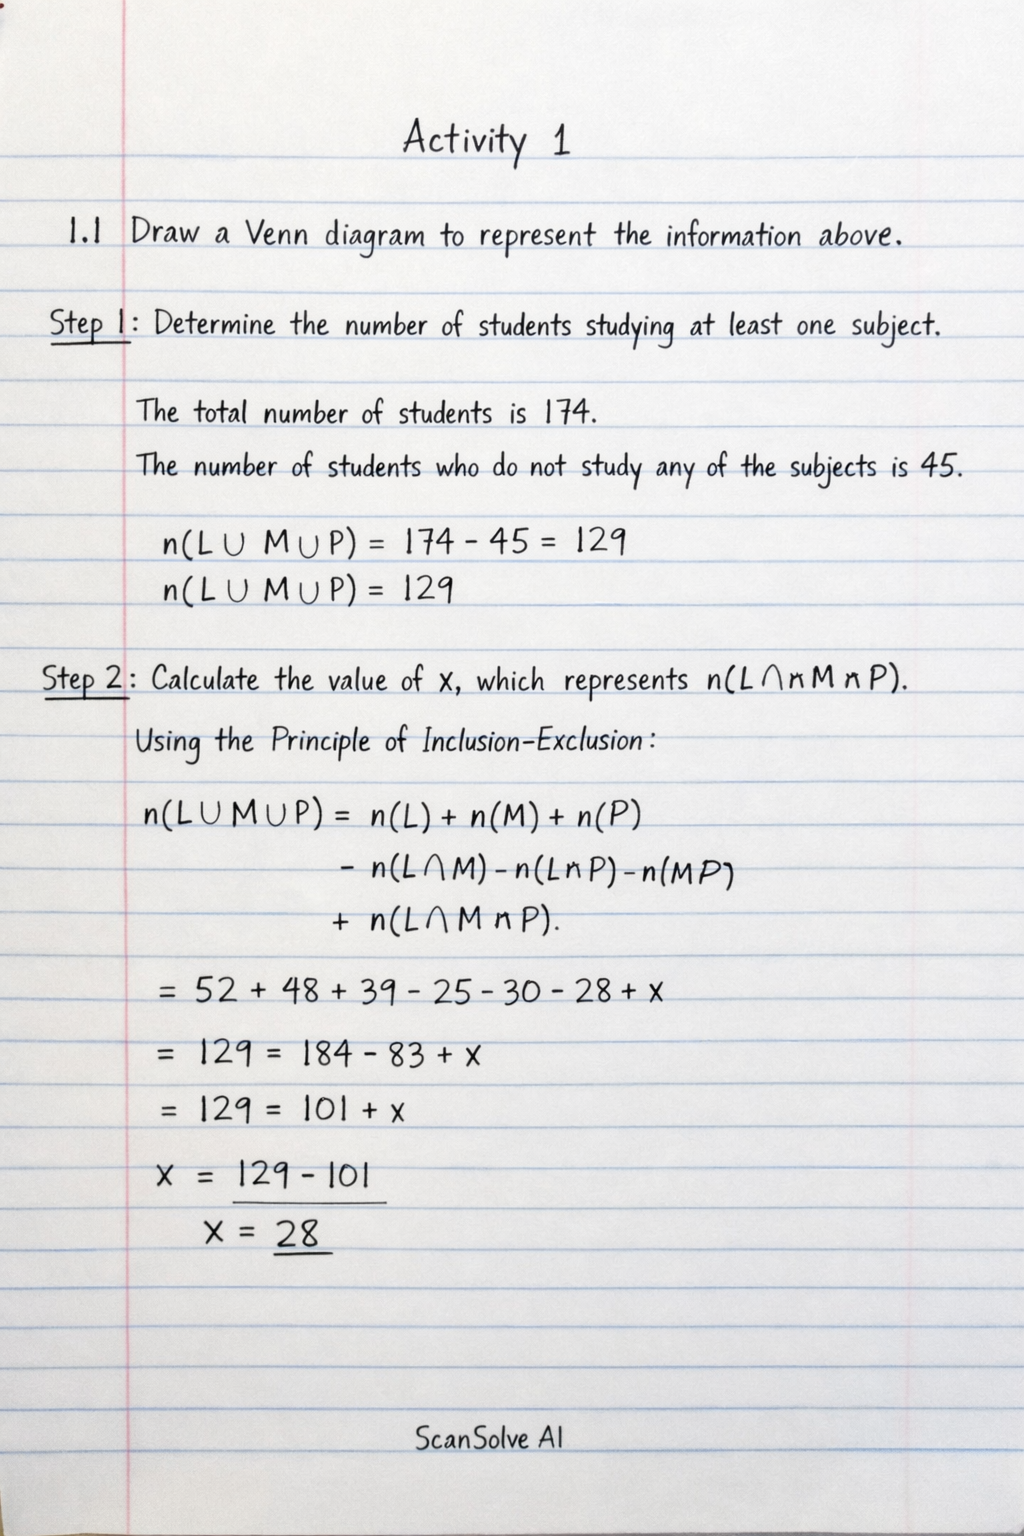
1.1 Draw a Venn diagram to represent the information above.
Step 1: Determine the number of students studying at least one subject.
The total number of students is 174.
The number of students who do not study any of the subjects is 45.
Step 2: Calculate the value of , which represents .
Using the Principle of Inclusion-Exclusion:
Was this helpful?
Still stuck on this one?
Ask a follow-up, and the answer starts from this question.
Got a different question?Ask your own question
More Mathematics Questions
QPlz represent the information on a venn diagramQA) Illustrate the information provided in a Venn Diagram.QAnd these of venn diagramQUsing set theory, represent the given voter information. Show this information in a Venn diagram.
Browse by topic:Discrete Math
Handwritten Step-by-Step Solution
Get this as a handwritten image on WhatsApp — like a tutor wrote it for you.
Try on WhatsApp