
We read your photo as:
How do you draw the straight line graphs for the equations y = -2x + 3 and x + y = 5?
ScanSolve AI Answer
Use the left and right arrow keys to trace the curve, up and down to jump between key points, and plus and minus to zoom.
| Point | x | y |
|---|---|---|
| y-intercept | 0 | 3 |
| x-intercept | 1.5 | 0 |
Step-by-step solution
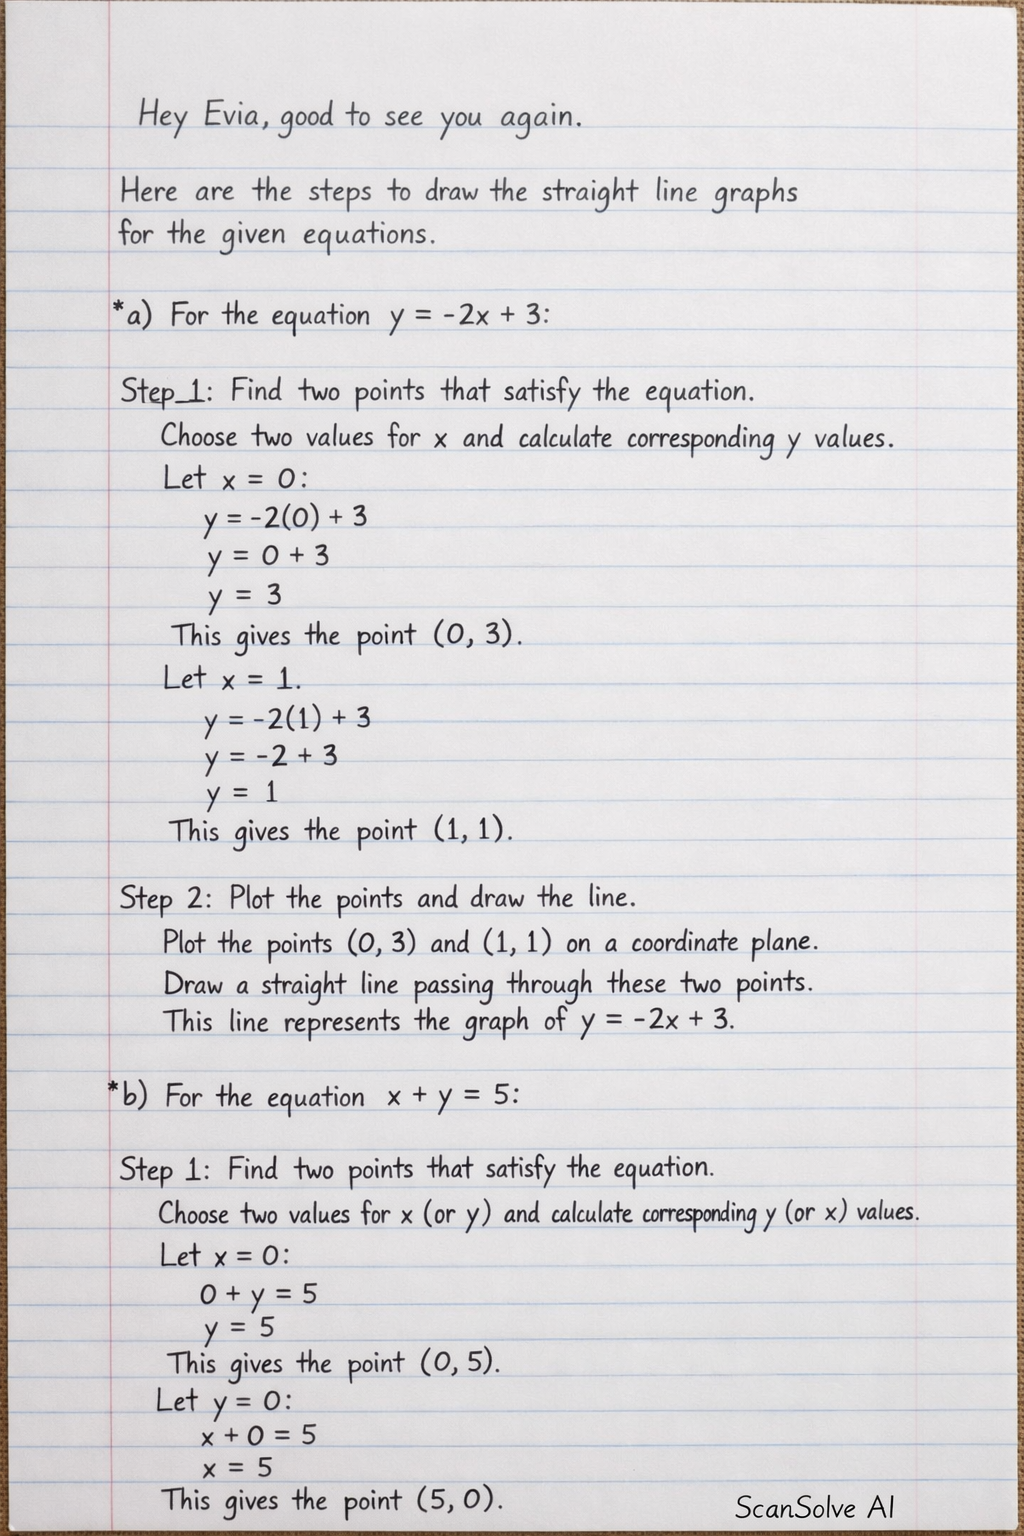
4 stepsHere are the steps to draw the straight line graphs for the given equations.
Part a· 2 steps
For the equation
Find two points that satisfy the equation.
Choose two values for and calculate the corresponding values.
- Let :
This gives the point .
- Let :
This gives the point .
Plot the points and draw the line.
Plot the points and on a coordinate plane. Draw a straight line passing through these two points. This line represents the graph of .
Part b· 2 steps
For the equation
Find two points that satisfy the equation.
Choose two values for (or ) and calculate the corresponding (or ) values.
- Let :
This gives the point .
- Let :
This gives the point .
Plot the points and draw the line.
Plot the points and on a coordinate plane. Draw a straight line passing through these two points. This line represents the graph of .
Still stuck on this one?
Ask a follow-up, and the answer starts from this question.
More Mathematics Questions
Handwritten Step-by-Step Solution
Get this as a handwritten image on WhatsApp — like a tutor wrote it for you.
Try on WhatsApp