
We read your photo as:
During germination and growth of a cereal, the dry weight of endosperm, the embryo and the total dry weight were determined at two day intervals. The results are shown in the table below: a) Using the same axes, draw graphs of dry weight of endosperm, embryo and the total dry weight against time.
Biology
ScanSolve AI Answer
Step-by-step solution
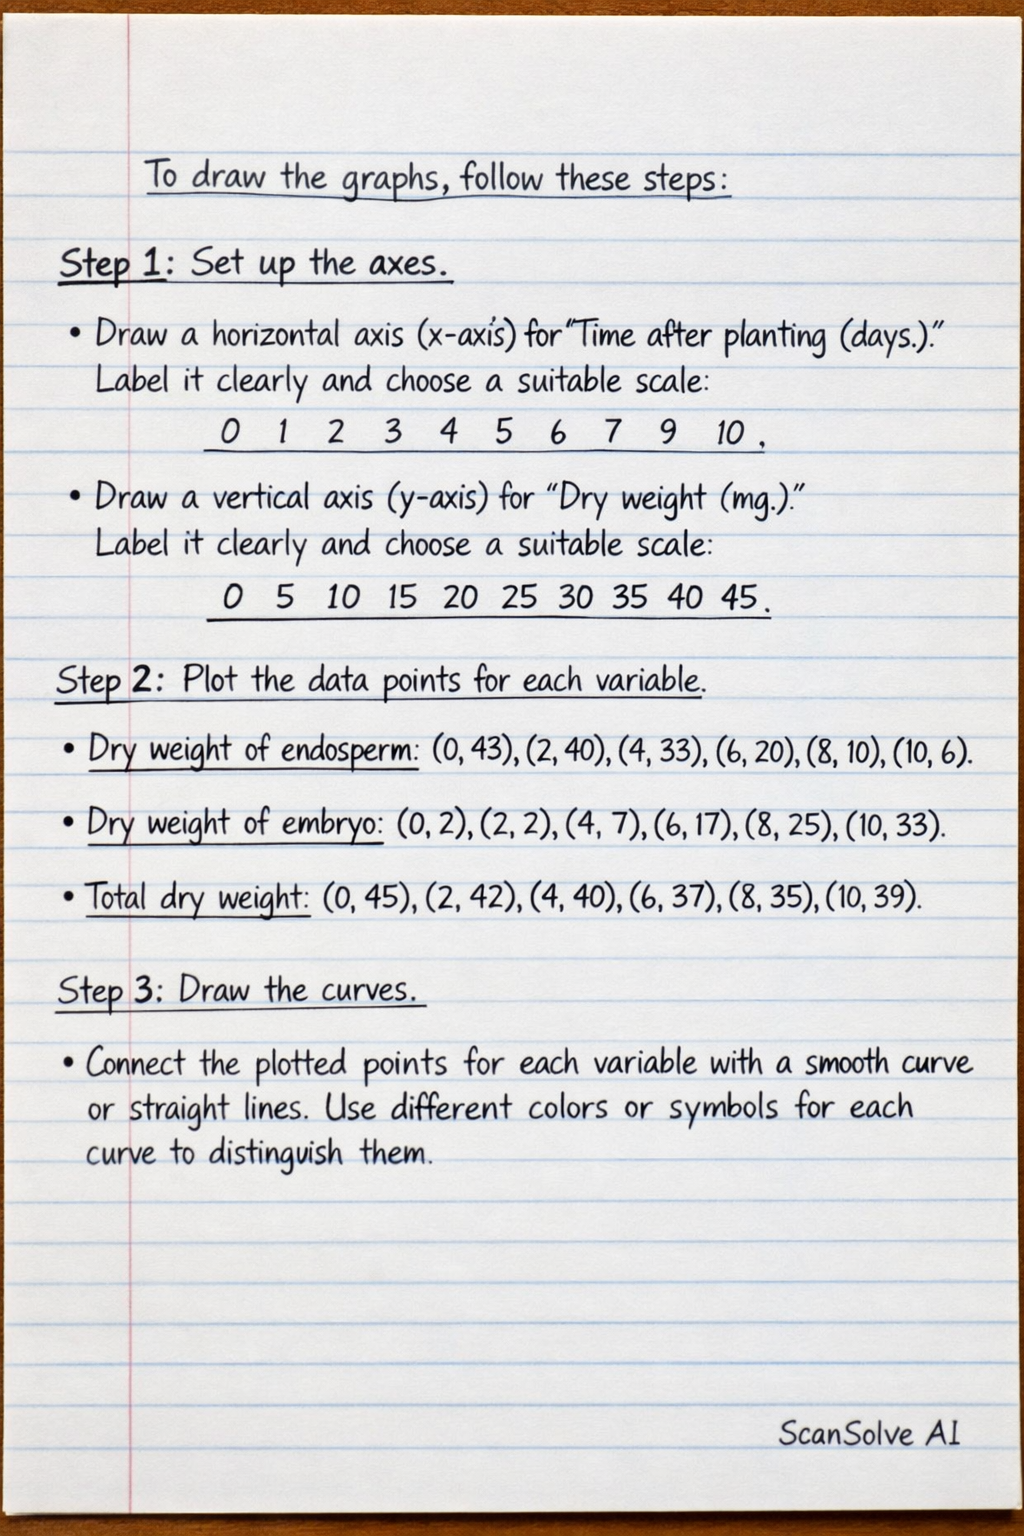
4 stepsTo draw the graphs, follow these steps:
Set up the axes.
- Draw a horizontal axis (x-axis) for "Time after planting (days)". Label it clearly and choose a suitable scale (e.g., 1 cm represents 1 day). The range should be from 0 to 10 days.
- Draw a vertical axis (y-axis) for "Dry weight (mg)". Label it clearly and choose a suitable scale (e.g., 1 cm represents 5 mg). The range should be from 0 to at least 45 mg (the maximum value in the table).
Plot the data points for each variable.
- Dry weight of endosperm: Plot the points (0, 43), (2, 40), (4, 33), (6, 20), (8, 10), (10, 6).
- Dry weight of embryo: Plot the points (0, 2), (2, 2), (4, 7), (6, 17), (8, 25), (10, 33).
- Total dry weight: Plot the points (0, 45), (2, 42), (4, 40), (6, 37), (8, 35), (10, 39).
Draw the curves.
- Connect the plotted points for each variable with a smooth curve or straight lines. Use different colors or symbols for each curve to distinguish them.
Label the curves and add a title.
- Label each curve clearly, for example, "Endosperm Dry Weight", "Embryo Dry Weight", and "Total Dry Weight".
- Add a title to the graph, such as "Changes in Dry Weight of Endosperm, Embryo, and Total Dry Weight During Germination".
Expected appearance of the graphs:
- The endosperm dry weight curve will start high and show a continuous decrease over time, indicating that the stored food is being utilized.
- The embryo dry weight curve will start low and show a continuous increase over time, indicating growth of the embryo.
- The total dry weight curve will start at 45 mg, decrease initially (due to respiration and loss of water), and then show a slight increase or stabilization towards the end as the seedling begins photosynthesis, but overall, it will show a general decrease from the initial value.
2 zimekamilika. Zimebaki 3 leo — tuma inayofuata.
Was this helpful?
Still stuck on this one?
Ask a follow-up, and the answer starts from this question.
Got a different question?Ask your own question
More Biology Questions
QExplain the changes in dry weight of a germinating seedling over a 10-day period.QDescribe the results for the potato shoots. With reference to your graph, explain the shape of the…QExplain the results of an iodine test on a non-germinating maize grain, detailing the color changes…QThe height of 100 maize plants were measured to the nearest centimeter and the results recorded in…QDraw a graph to show this growth by plotting Mass against Time after hatching. Create an appropriate…
Handwritten Step-by-Step Solution
Get this as a handwritten image on WhatsApp — like a tutor wrote it for you.
Try on WhatsApp