
We read your photo as:
Suggest a hypothesis and describe the procedure for an experiment investigating the effect of enzyme concentration on reaction rate, using yeast and methylene blue.
Biology
ScanSolve AI Answer
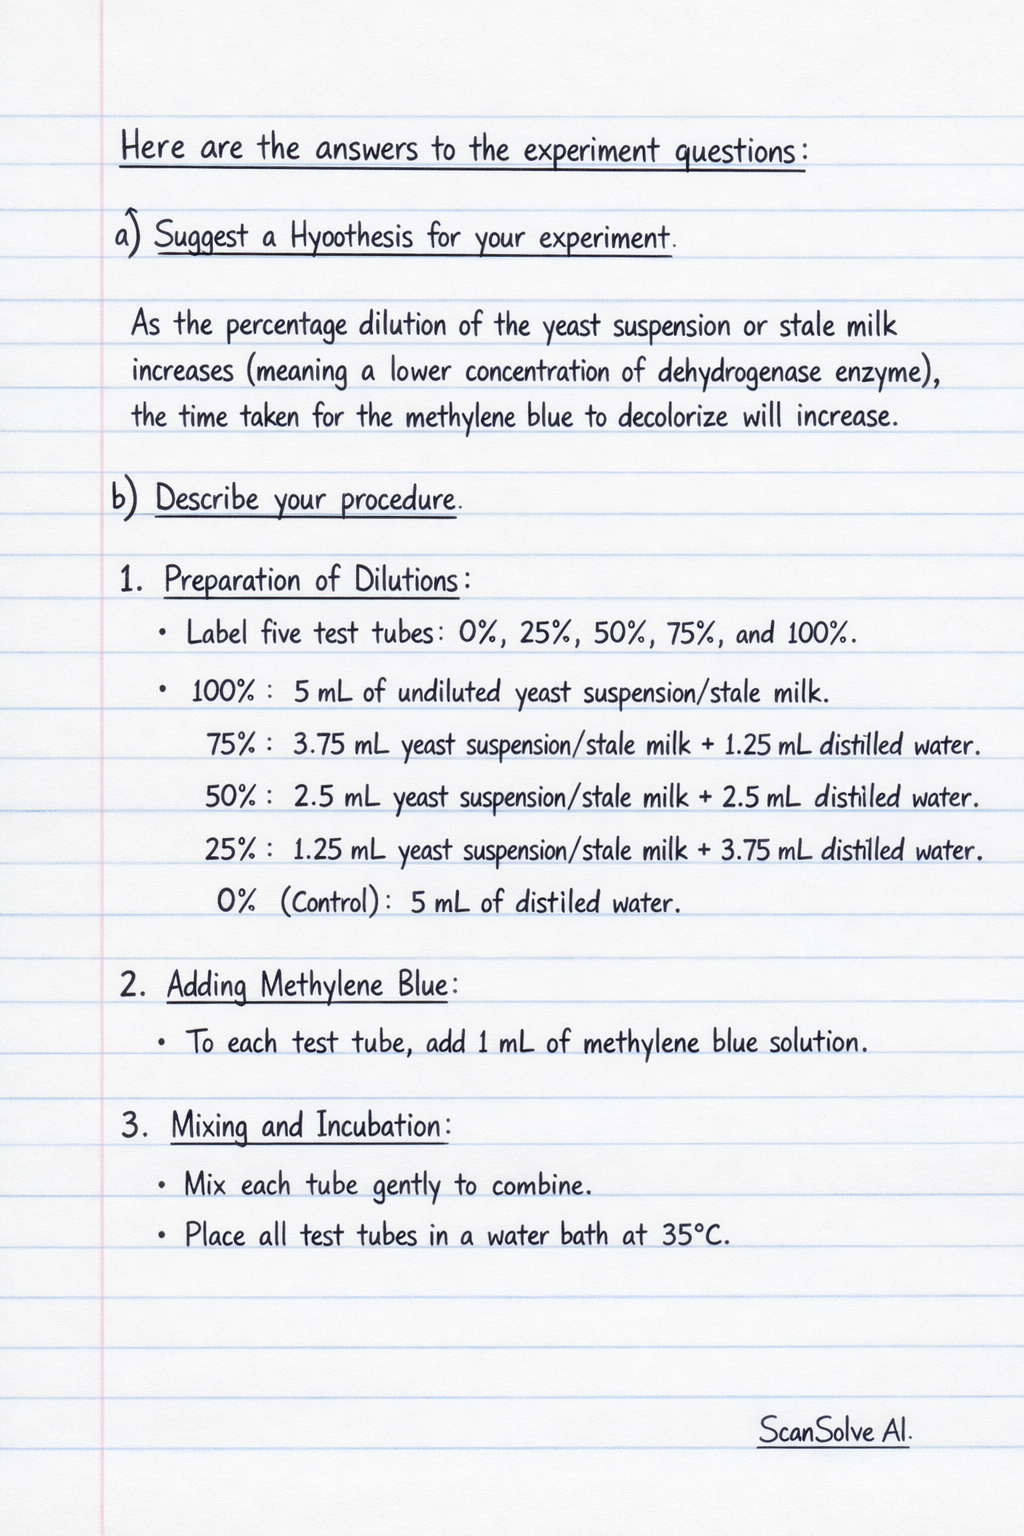
Here are the answers to the experiment questions:
a) Suggest a Hypothesis for your experiment
As the percentage dilution of the yeast suspension or stale milk increases (meaning a lower concentration of dehydrogenase enzyme), the time taken for the methylene blue to decolorize will increase.
b) Describe your procedure
- Preparation of Dilutions:
- Label five test tubes: 0%, 25%, 50%, 75%, and 100%.
- Using measuring cylinders or pipettes, prepare 5 mL of each dilution:
- 100%: 5 mL of undiluted yeast suspension/stale milk.
- 75%: 3.75 mL of yeast suspension/stale milk + 1.25 mL of distilled water.
- 50%: 2.5 mL of yeast suspension/stale milk + 2.5 mL of distilled water.
- 25%: 1.25 mL of yeast suspension/stale milk + 3.75 mL of distilled water.
- 0% (Control): 5 mL of distilled water.
- Adding Methylene Blue:
- To each test tube, add 1 mL of methylene blue solution.
- Mixing and Incubation:
- Gently shake each test tube to mix the contents thoroughly until the solution is uniformly blue.
- Place all five test tubes simultaneously into a water bath set at a constant temperature (e.g., 37°C) to ensure optimal enzyme activity and consistent conditions.
- Timing Decolorization:
- Immediately start a stopwatch as the test tubes are placed in the water bath.
- Observe each test tube carefully. Record the exact time, in minutes, when the blue color completely disappears (decolorizes) for each dilution.
- Stop the stopwatch for each tube individually as its decolorization is complete.
- Recording Results:
- Record the decolorization times in a table.
- Replication:
- Repeat the entire experiment at least three times for each dilution to ensure the reliability and accuracy of the results. Calculate the average time for decolorization for each dilution.
c) Record your results on the table below
Hypothetical data based on the hypothesis in part a:
| % Dilution of stock | 0% | 20% | 40% | 80% | 100% |
|---|---|---|---|---|---|
| Time for decolourisation in minutes | No decolorization | 40 | 25 | 10 | 5 |
Was this helpful?
Still stuck on this one?
Ask a follow-up, and the answer starts from this question.
Got a different question?Ask your own question
More Biology Questions
QDesign an experiment to test the effect of substrate concentration on enzyme activity using yeast to…QExplain the relationship between yeast concentration and enzyme activity in decolorizing methylene…QSuggest a hypothesis and describe the procedure for an experiment investigating the effect of…QAn experiment was conducted to investigate the effect of substrate concentration on enzyme activity…QPropose a hypothesis for an experiment involving enzyme activity, identify variables (independent…
Handwritten Step-by-Step Solution
Get this as a handwritten image on WhatsApp — like a tutor wrote it for you.
Try on WhatsApp