
This business/management problem is solved step by step below, with detailed explanations to help you understand the method and arrive at the correct answer.
ScanSolve AI Answer
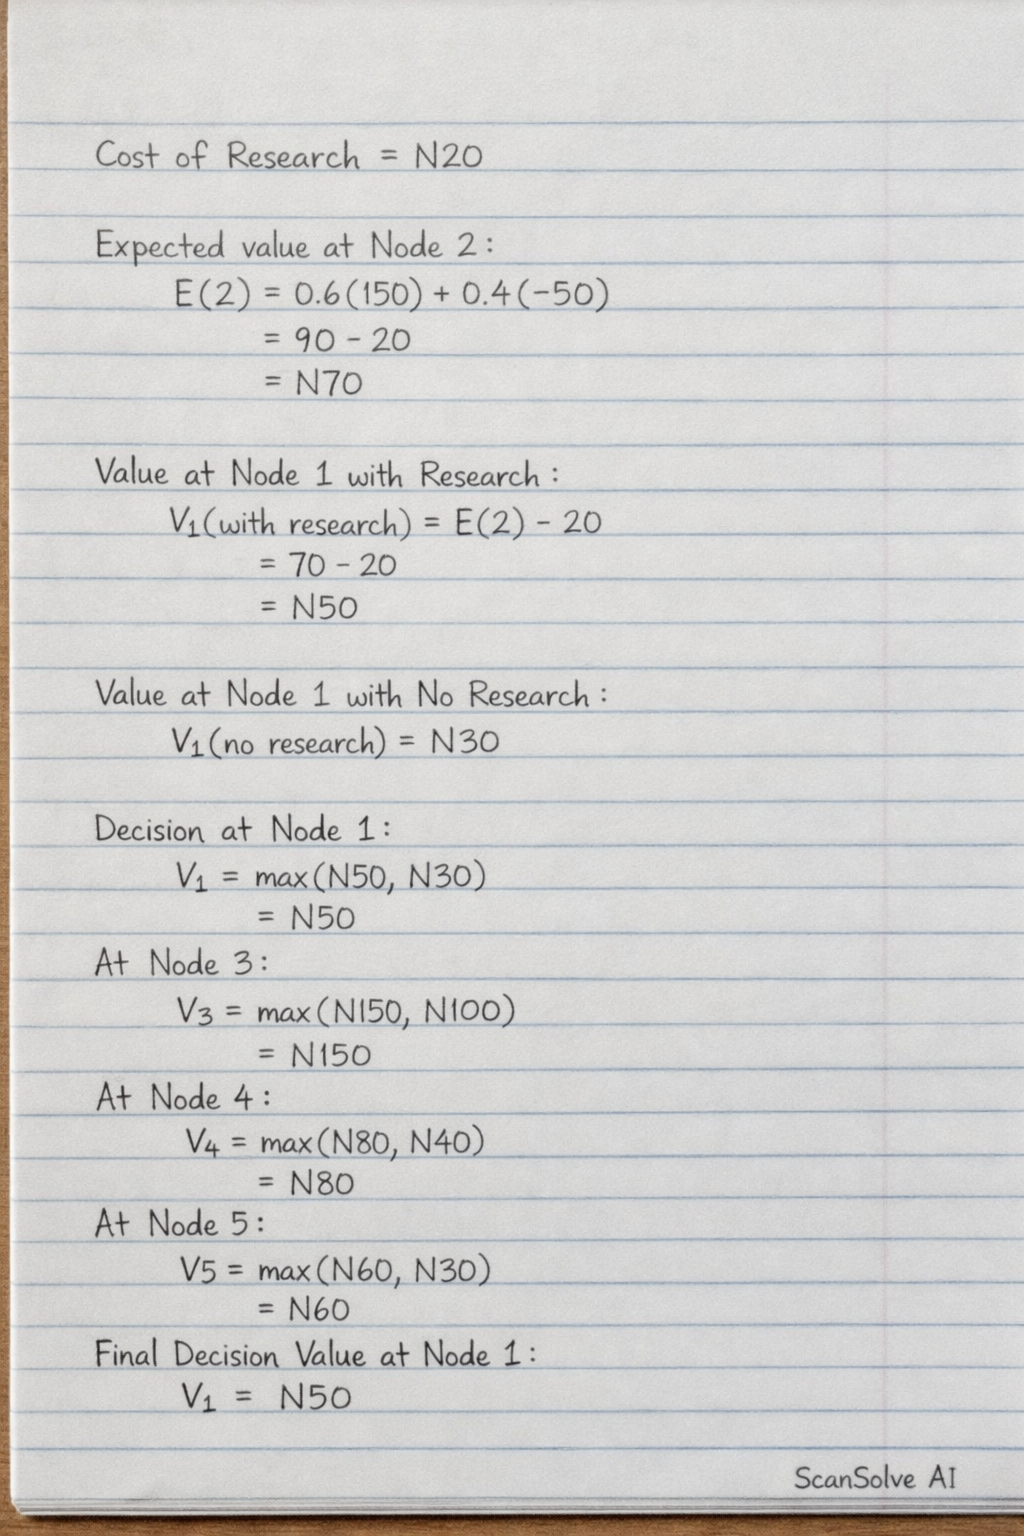
Hey abiyibameyi — ready when you are. This image displays a decision tree, which is a visual tool used in decision analysis to map out possible courses of action, their potential outcomes, and the associated probabilities and costs/payoffs. Here's a breakdown of the components visible in your diagram: Square Nodes (1, 3, 4, 5): These are decision nodes*. They represent points where a decision-maker must choose between different alternatives. Node 1: The initial decision point, offering choices to "Research" or "No Research". Nodes 3, 4, 5: Subsequent decision points, offering choices to "Manufacture" or "Purchase". Circle Node (2): This is a chance node* (or probability node). It represents a point where an uncertain event will occur, with different possible outcomes. Node 2: Shows two possible outcomes after research: "Favorable" or "Unfavorable". Branches: These lines connect the nodes and represent the different choices or outcomes. The "Research" branch from Node 1 has an associated cost of N20*. The branches from the chance node (Node 2) represent the possible states of nature (favorable or unfavorable). The branches from the decision nodes (3, 4, 5) represent the actions that can be taken (manufacture or purchase). To fully analyze this decision tree and determine the optimal path, we would need additional information, specifically: • The probabilities of the "Favorable" and "Unfavorable" outcomes at Node 2. • The payoffs (profits or losses) associated with each final outcome (e.g., manufacturing or purchasing under favorable/unfavorable conditions, or without research). This structure helps visualize the sequence of decisions and uncertain events. Got more? Send 'em.