
We read your photo as:
I) Determine the solubility of X at different temperatures and plot a solubility curve. ii) Explain the trend observed in the solubility curve.
Chemistry
ScanSolve AI Answer
This answer stops before the end.
It was cut off when it was first written. Ask ScanSolve this question again for the full working.
Here are the solutions for the questions based on the provided image.
1. i) Determine the solubility of X at different temperatures and plot a solubility curve.
Step 1: Calculate the solubility of solid X for each volume of distilled water used.
The mass of solid X is 4.5 g. The density of water is approximately 1 g/, so the mass of water in grams is equal to its volume in .
Solubility is calculated as:
Was this helpful?
Still stuck on this one?
Ask a follow-up, and the answer starts from this question.
Got a different question?Ask your own question
More Chemistry Questions
QDetermine the solubility of X at different temperatures and plot a solubility curve.QDraw and label the axes. The x-axis should represent Temperature (^ C) and the y-axis should…QAn experiment was designed to measure the effect of temperature on solubility. i) What is the…QIdentify laboratory apparatus and explain the concept of solubility, including factors affecting it…QIdentify laboratory apparatus, explain solubility, and describe an experiment to determine the…
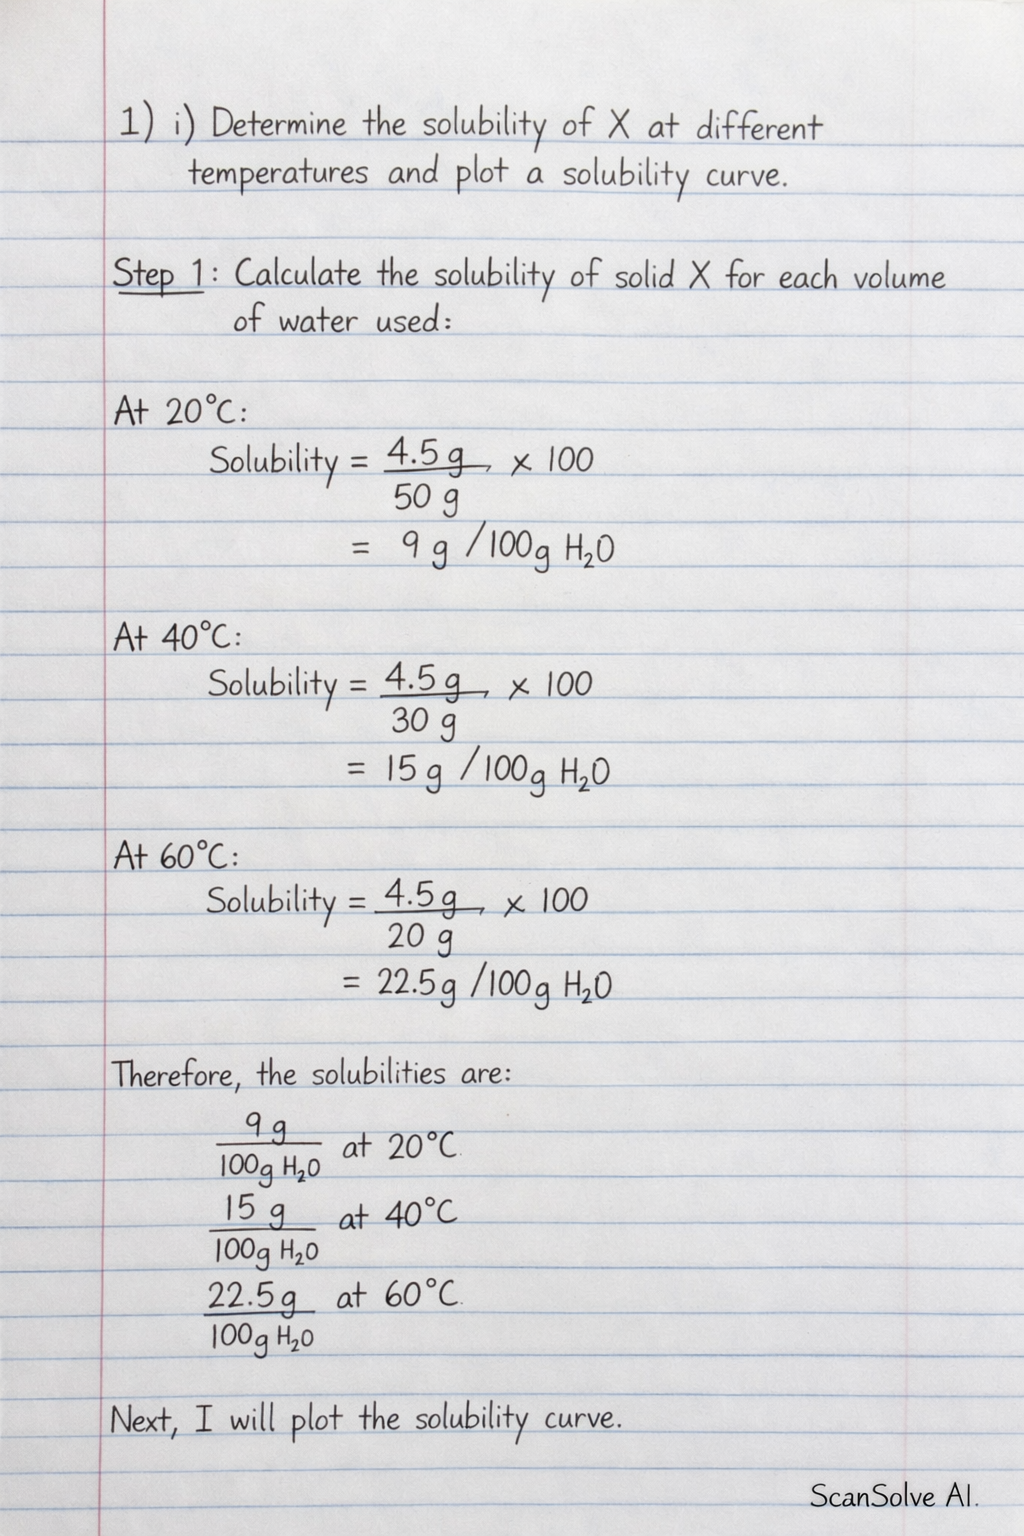
Handwritten Step-by-Step Solution
Get this as a handwritten image on WhatsApp — like a tutor wrote it for you.
Try on WhatsApp