

This computer science problem involves algorithmic thinking and programming concepts. The solution below explains the approach, logic, and implementation step by step.
ScanSolve AI Answer
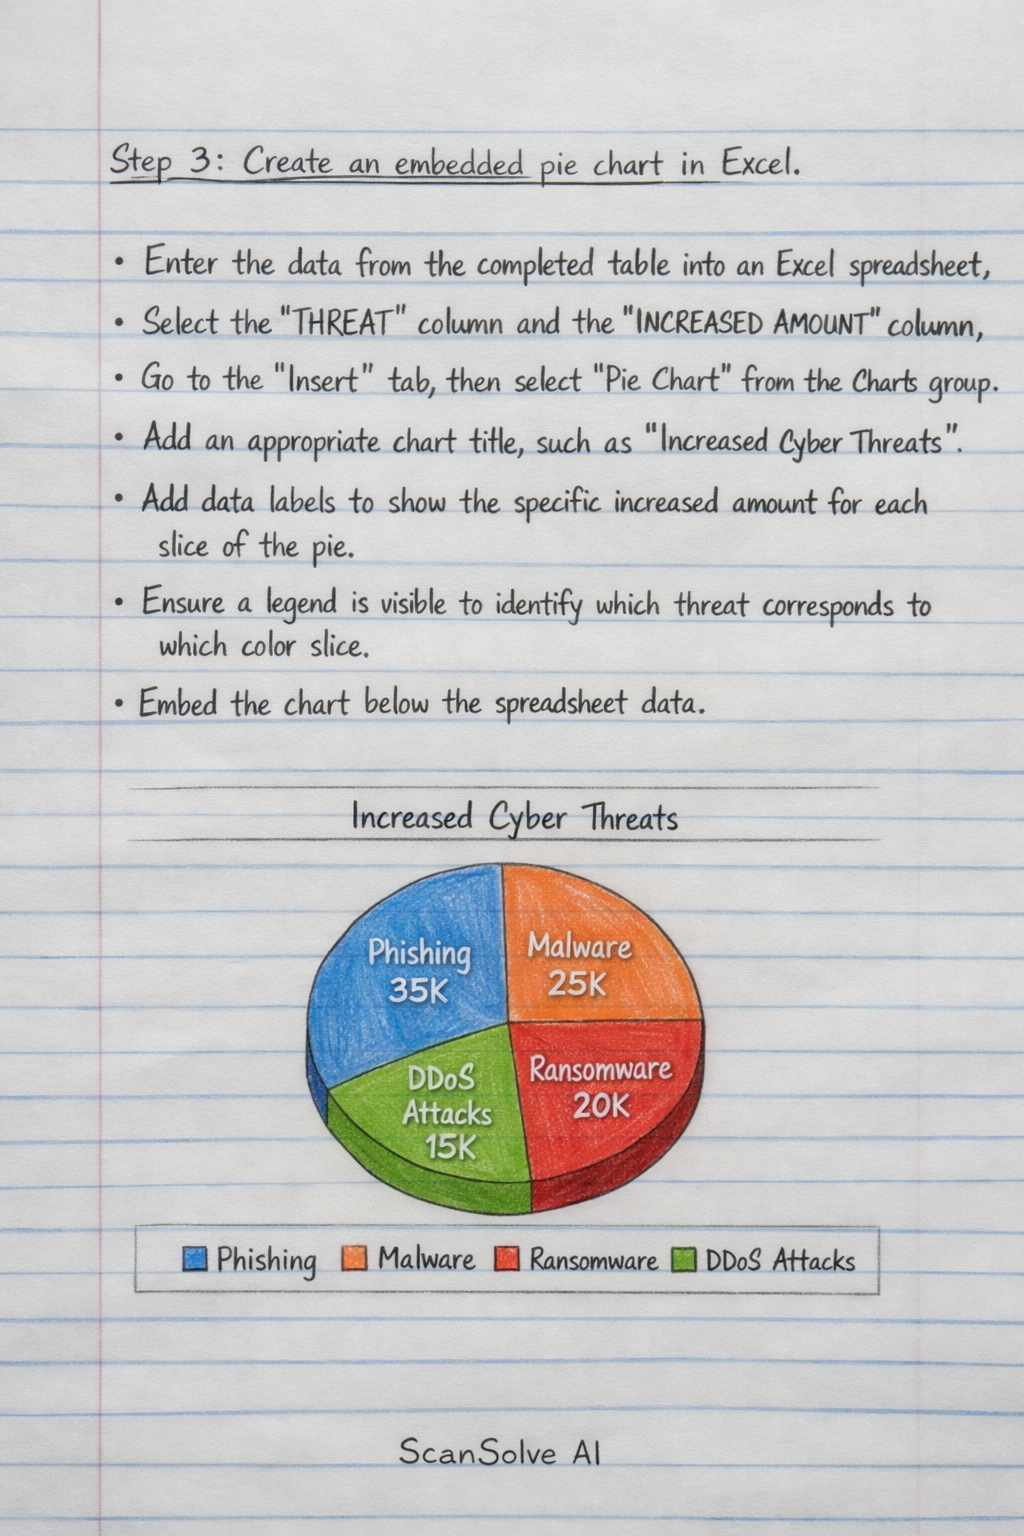
Here's how to complete Subtask 2: Create a chart. Step 1: Calculate the "Increased Amount" for each cyber threat. The increased amount is found by subtracting the "PRESENT" value from the "FUTURE" value. DDoS attacks: 69 - 61 = 8 Compromised third parties: 52 - 50 = 2 Android malware: 42 - 35 = 7 Nation-state attacks: 45 - 26 = 19 Cyber extortion: 42 - 19 = 23 Clickjacking: 24 - 19 = 5 Step 2: Complete the spreadsheet with the calculated "Increased Amount". l — c — c — c THREAT & PRESENT & FUTURE & INCREASED AMOUNT \\ DDoS attacks & 61 & 69 & 8 \\ Compromised third parties & 50 & 52 & 2 \\ Android malware & 35 & 42 & 7 \\ Nation-state attacks & 26 & 45 & 19 \\ Cyber extortion & 19 & 42 & 23 \\ Clickjacking & 19 & 24 & 5 \\ Step 3: Create an embedded pie chart in Excel. To create the pie chart displaying the increased amount of all threats: Enter the data from the completed table into an Excel spreadsheet. Select the "THREAT" column and the "INCREASED AMOUNT" column. Go to the "Insert" tab, then select "Pie Chart" from the Charts group. Add an appropriate chart title, such as "Increased Cyber Threats". Add data labels to show the specific increased amount for each slice of the pie. Ensure a legend is visible to identify which threat corresponds to which color slice. Embed the chart below the spreadsheet data.