

This economics question tests your understanding of economic models and analysis. The step-by-step answer below applies the relevant framework and explains the reasoning.
ScanSolve AI Answer
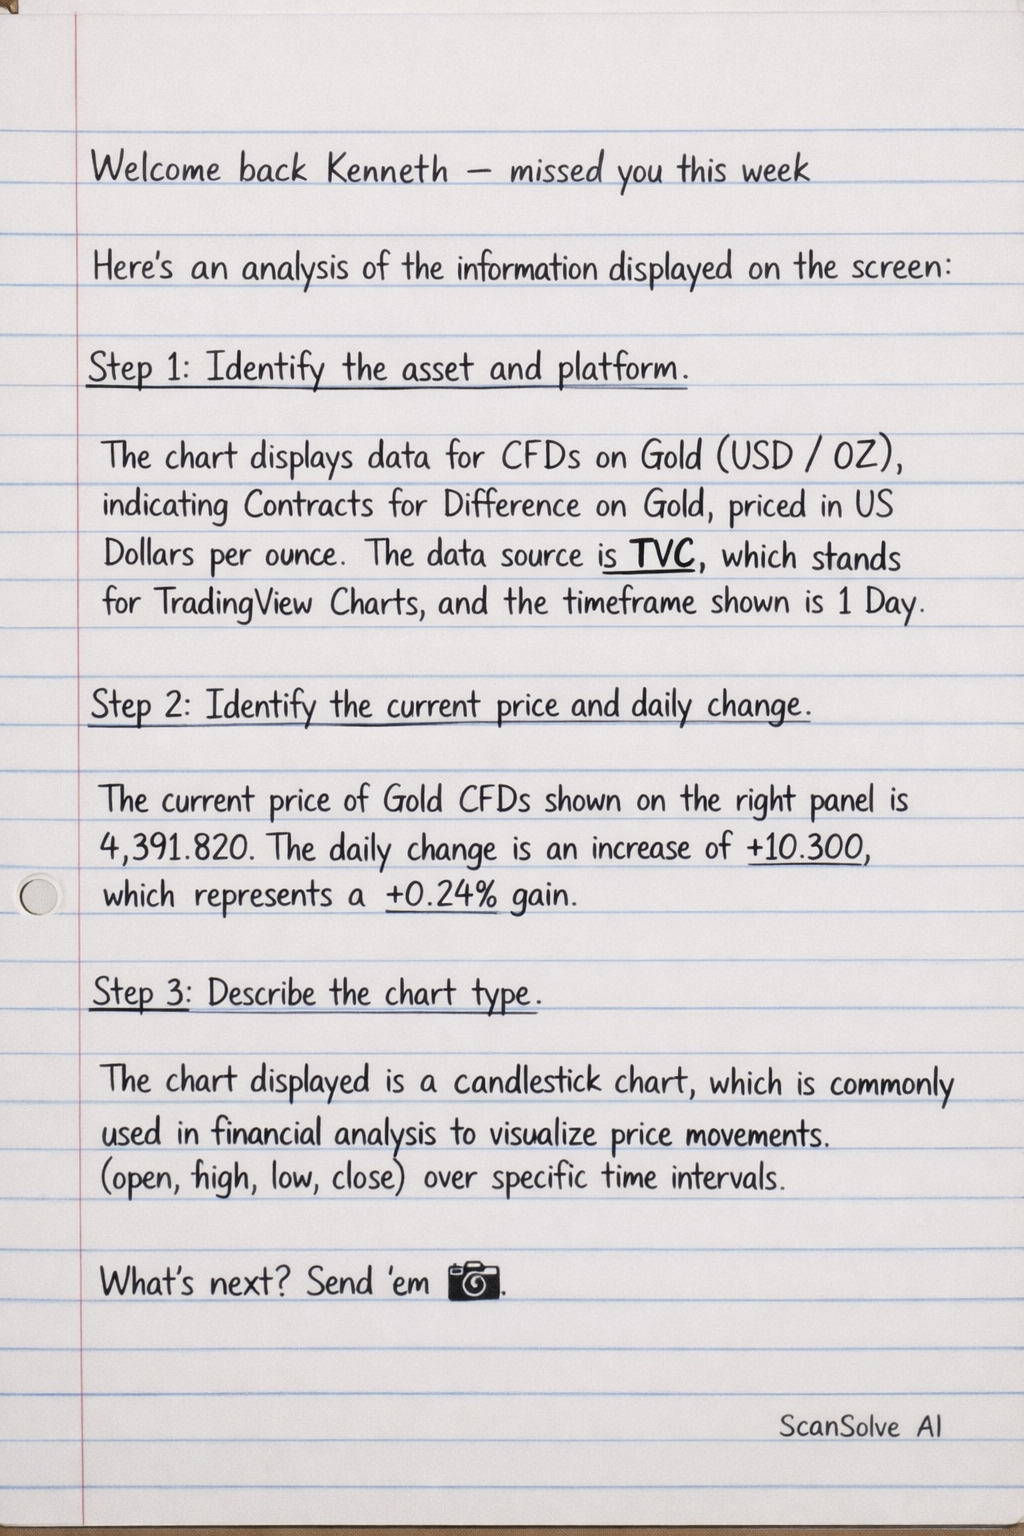
Here's an analysis of the information displayed on the screen: Step 1: Identify the asset and platform. The chart displays data for CFDs on Gold (USD / OZ), indicating Contracts for Difference on Gold, priced in US Dollars per ounce. The data source is TVC, which stands for TradingView Charts, and the timeframe shown is 1 Day. Step 2: Identify the current price and daily change. The current price of Gold CFDs shown on the right panel is 4,391.820. The daily change is an increase of +10.300, which represents a +0.24% gain. Step 3: Describe the chart type. The chart displayed is a candlestick chart, which is commonly used in financial analysis to visualize price movements (open, high, low, close) over specific time intervals. What's next? Send 'em 📸