
We read your photo as:
Analyze the provided monthly rainfall chart to answer questions about rainfall patterns and their implications for farming.
ScanSolve AI Answer
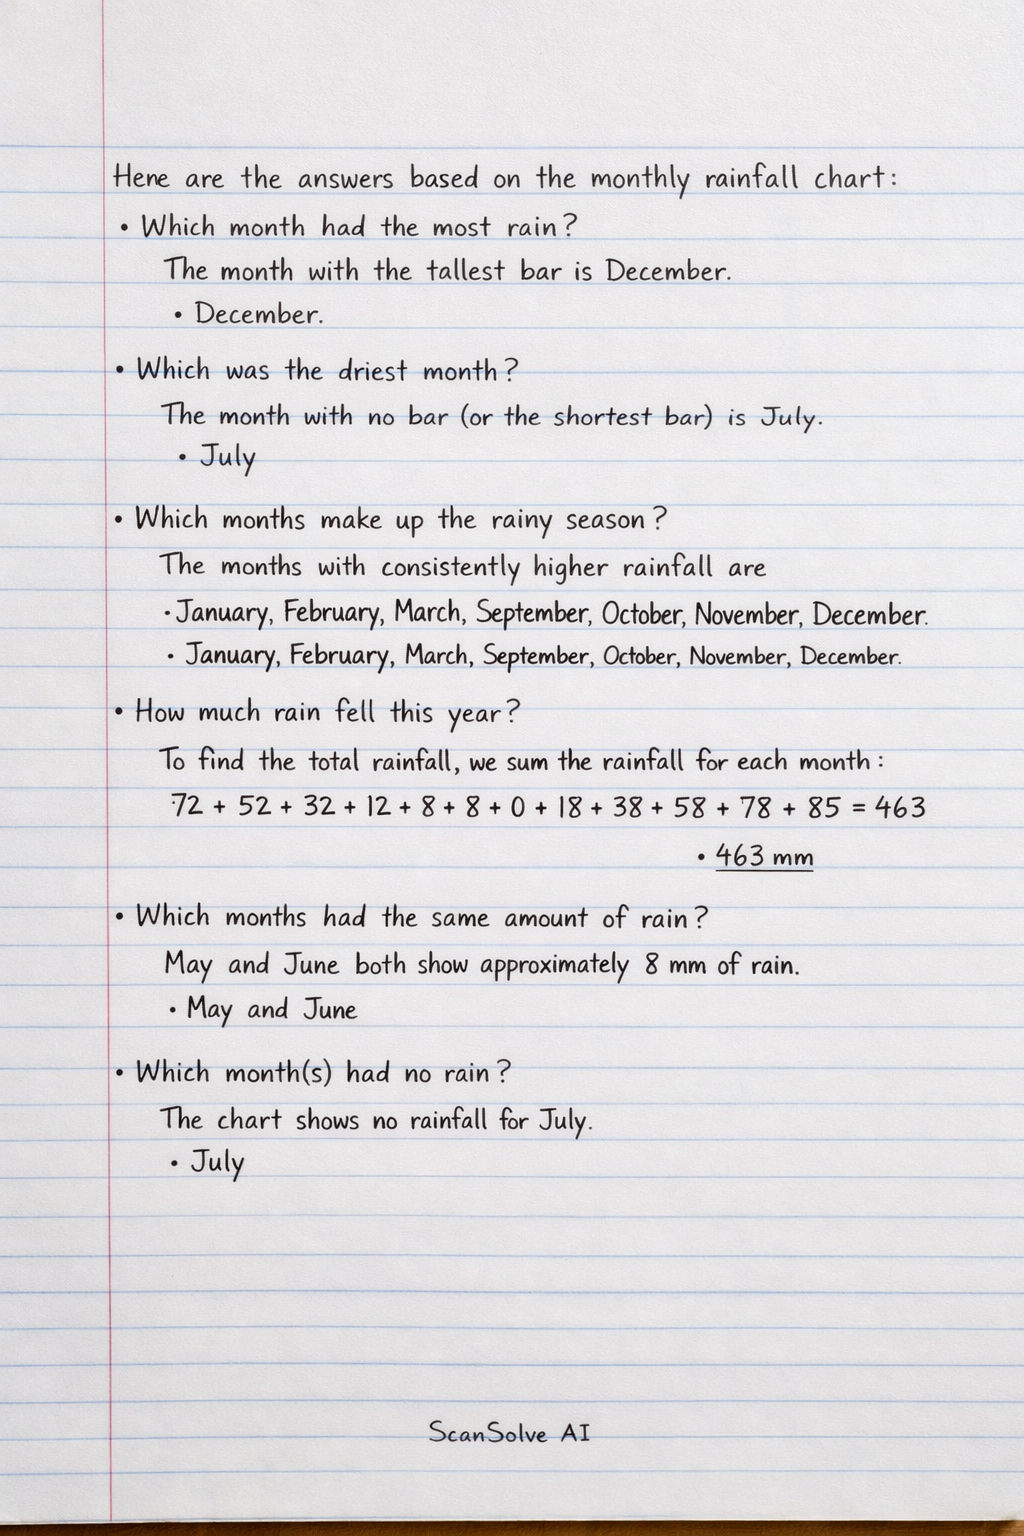
Here are the answers based on the monthly rainfall chart:
-
Which month had the most rain? The month with the tallest bar is December.
- December
-
Which was the driest month? The month with no bar (or the shortest bar) is July.
- July
-
Which months make up the rainy season? The months with consistently higher rainfall are January, February, March, and then September, October, November, December.
- January, February, March, September, October, November, December
-
How much rain fell this year? To find the total rainfall, we sum the rainfall for each month:
- 463 mm
-
Which months had the same amount of rain? May and June both show approximately 8 mm of rain.
- May and June
-
Which month(s) had no rain? The chart shows no rainfall for July.
- July
-
When do you think is the best time for farmers to start planting crops? Why? Farmers need sufficient water for crops to grow. The rainfall chart shows a significant increase in rain starting from September and continuing through December, with December being the wettest month. Therefore, planting in September or October would allow crops to benefit from the increasing rainfall and establish themselves during the wet season.
- September or October, because the rainfall starts to increase significantly in September and continues to be high through December, providing ample water for crop growth.
Still stuck on this one?
Ask a follow-up, and the answer starts from this question.
More Geography Questions
Handwritten Step-by-Step Solution
Get this as a handwritten image on WhatsApp — like a tutor wrote it for you.
Try on WhatsApp