
Can you show me how to draw the graph for the pizza
Economics
ScanSolve AI Answer
Step-by-step solution
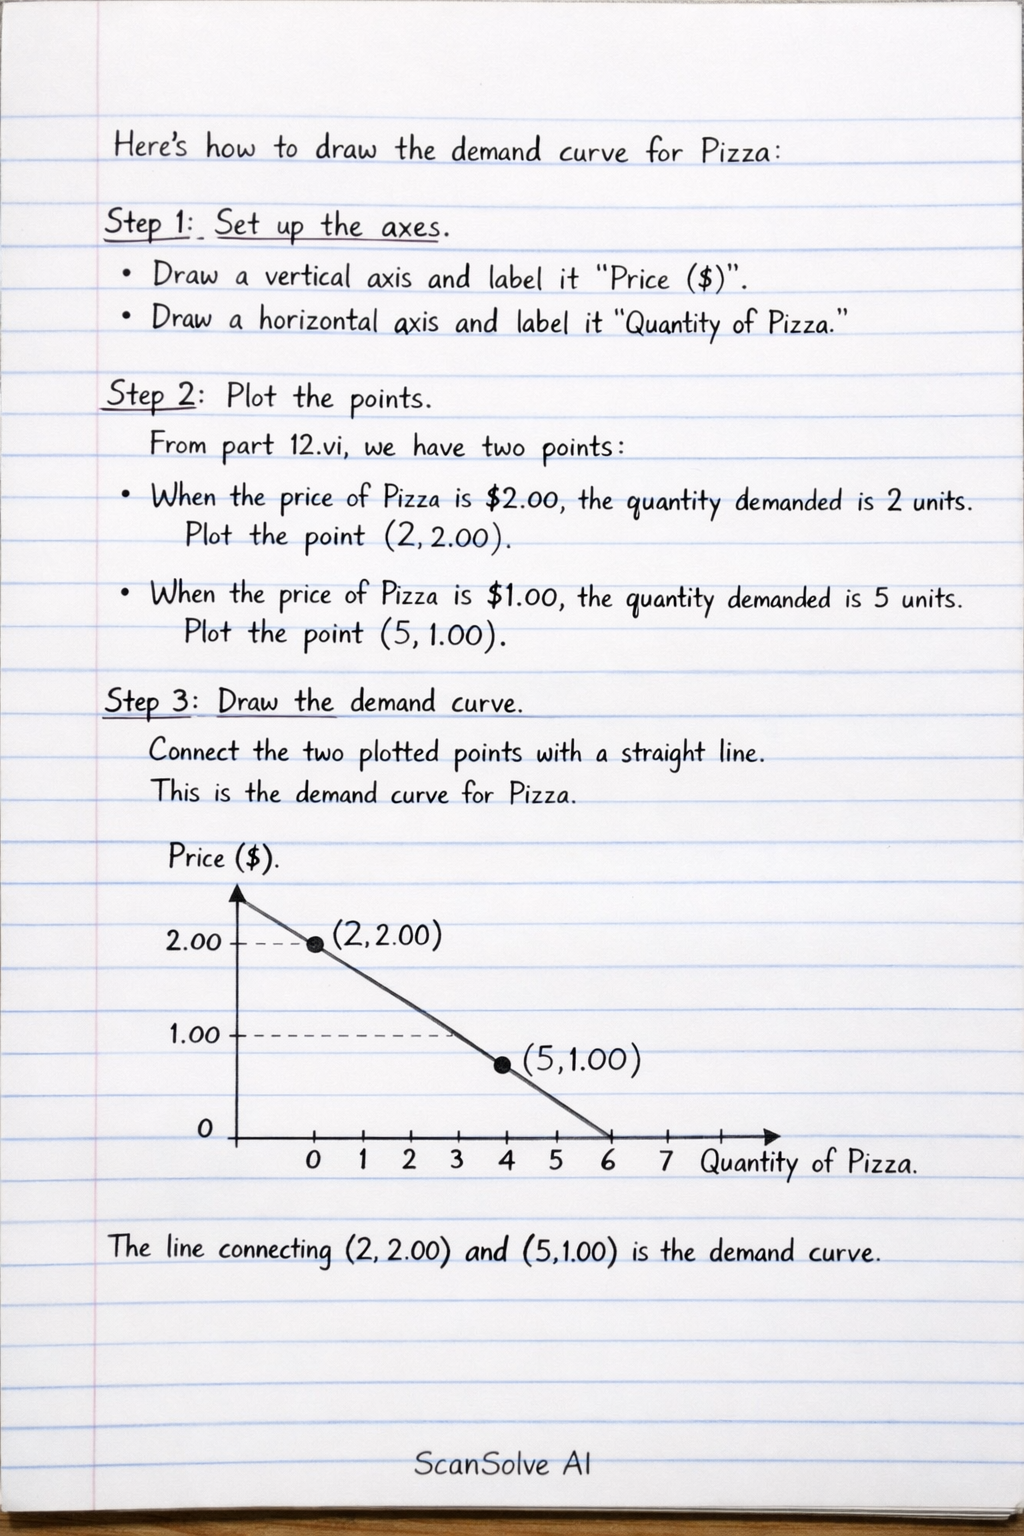
3 stepsHere's how to draw the demand curve for Pizza:
Set up the axes.
- Draw a vertical axis (y-axis) and label it "Price ($)".
- Draw a horizontal axis (x-axis) and label it "Quantity of Pizza".
Plot the points.
- From part 12.vi, we have two points:
- When the price of Pizza is $2.00, the quantity demanded is 2 units. Plot the point (2, 2.00).
- When the price of Pizza is $1.00, the quantity demanded is 5 units. Plot the point (5, 1.00).
- From part 12.vi, we have two points:
Draw the demand curve.
- Connect the two plotted points with a straight line. This line represents the demand curve for Pizza. It should slope downwards from left to right, illustrating the law of demand.
The graph will look like this:
The line connecting and is the demand curve.
Was this helpful?
Still stuck on this one?
Ask a follow-up, and the answer starts from this question.
Got a different question?Ask your own question
More Economics Questions
Handwritten Step-by-Step Solution
Get this as a handwritten image on WhatsApp — like a tutor wrote it for you.
Try on WhatsApp