
We read your photo as:
Explain and illustrate the short-run cost curves: MC, ATC, AVC, and AFC.
ScanSolve AI Answer
Step-by-step solution
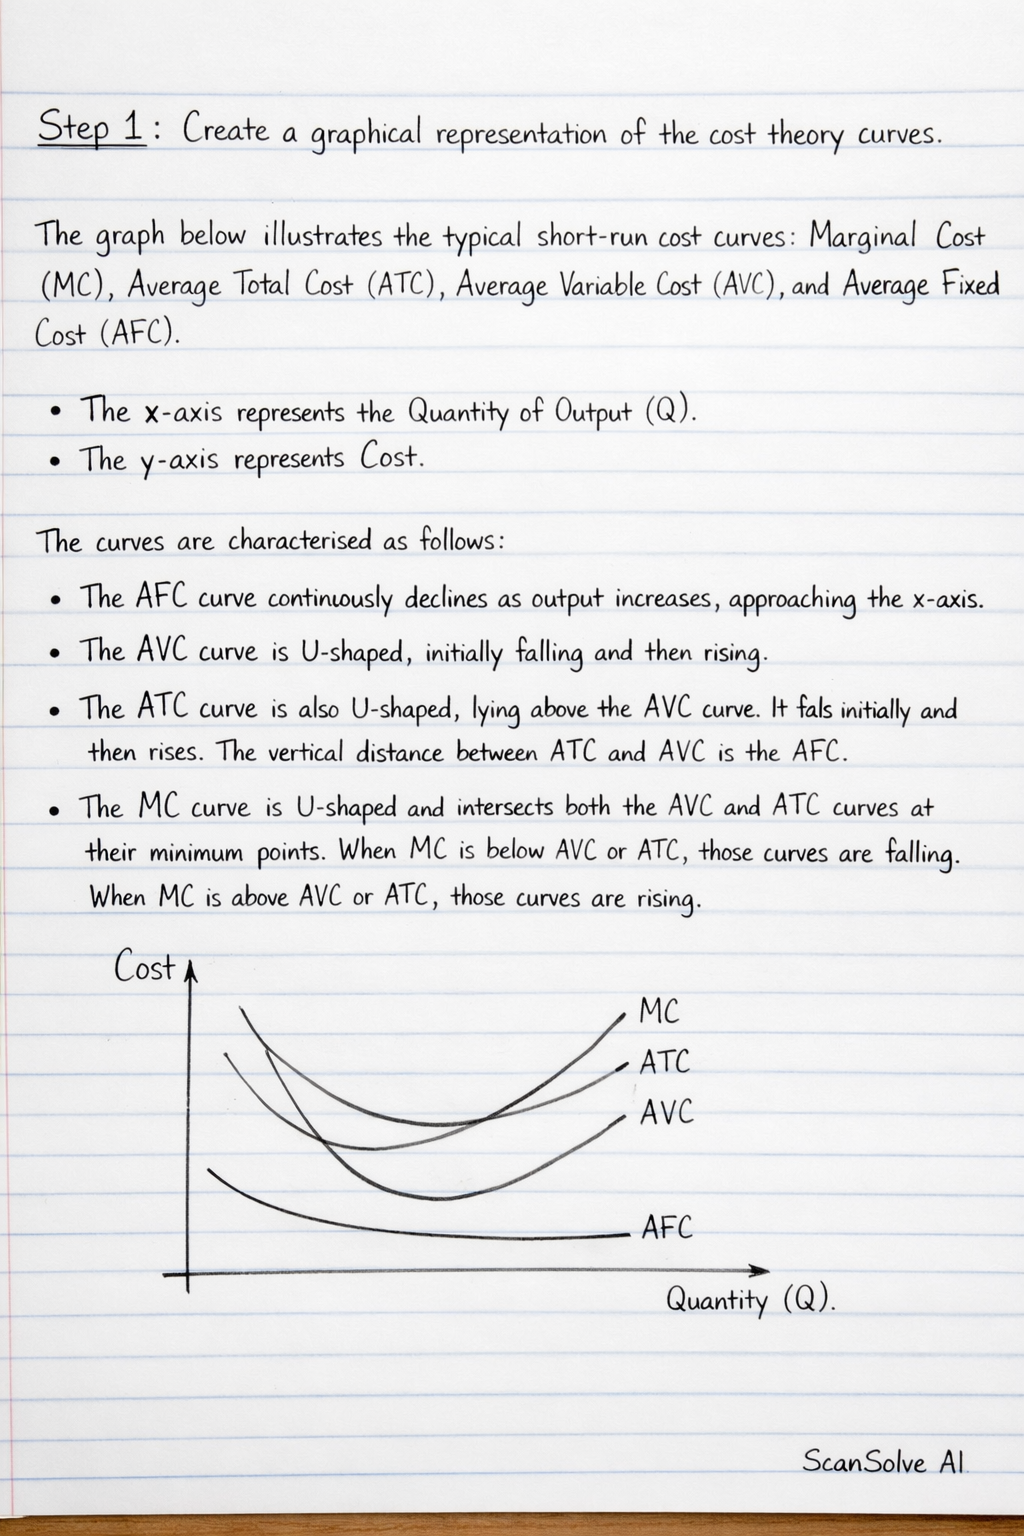
2 stepsCreate a graphical representation of the cost theory curves.
The graph below illustrates the typical short-run cost curves: Marginal Cost (MC), Average Total Cost (ATC), Average Variable Cost (AVC), and Average Fixed Cost (AFC).
- The x-axis represents the Quantity of Output (Q).
- The y-axis represents Cost.
The curves are characterized as follows:
- The AFC curve continuously declines as output increases, approaching the x-axis.
- The AVC curve is U-shaped, initially falling and then rising.
- The ATC curve is also U-shaped, lying above the AVC curve. It falls initially and then rises. The vertical distance between ATC and AVC is the AFC.
- The MC curve is U-shaped and intersects both the AVC and ATC curves at their respective minimum points. When MC is below AVC or ATC, those curves are falling. When MC is above AVC or ATC, those curves are rising.
\begin{tikzpicture}[scale=0.8] \draw[->] (0,0) -- (8,0) node[right] {Quantity (Q)}; \draw[->] (0,0) -- (0,7) node[above] {Cost}; % AFC curve \draw[blue, thick] (1,6) .. controls (3,2) and (5,1) .. (7,0.5) node[right] {AFC}; % AVC curve \draw[red, thick] (1,4) .. controls (2.5,1.5) and (4.5,2) .. (7,5) node[right] {AVC}; % ATC curve \draw[green, thick] (1,6.5) .. controls (3,3) and (5,3.5) .. (7,6) node[right] {ATC}; % MC curve \draw[orange, thick] (0.5,5) .. controls (2,1) and (3.5,2.5) .. (6,6.5) node[right] {MC}; % Intersection points (approximate) \fill (2.5,1.5) circle (1.5pt); % Min AVC \fill (3,3) circle (1.5pt); % Min ATC \end{tikzpicture}Briefly explain each cost curve.
-
a) Marginal Cost (MC) curve: The MC curve shows the additional cost incurred by producing one more unit of output. It reflects the change in total cost when output changes by one unit.
-
b) Average Variable Cost (AVC) curve: The AVC curve represents the total variable cost divided by the quantity of output. It indicates the variable cost per unit of production.
-
c) Average Total Cost (ATC) curve: The ATC curve shows the total cost (sum of fixed and variable costs) divided by the quantity of output. It represents the overall cost per unit of production.
-
d) Average Fixed Cost (AFC) curve: The AFC curve illustrates the total fixed cost divided by the quantity of output. It demonstrates how fixed costs are spread over an increasing number of units, causing the per-unit fixed cost to decline as output rises.
-
Still stuck on this one?
Ask a follow-up, and the answer starts from this question.
More Economics Questions
Handwritten Step-by-Step Solution
Get this as a handwritten image on WhatsApp — like a tutor wrote it for you.
Try on WhatsApp