
We read your photo as:
Study the graphs above and answer the questions that follow regarding market structure and firm behavior.
ScanSolve AI Answer
Step-by-step solution
4 stepsHere are the answers to your questions:
Part 4.15
Study the graph above and answer the questions that follow.
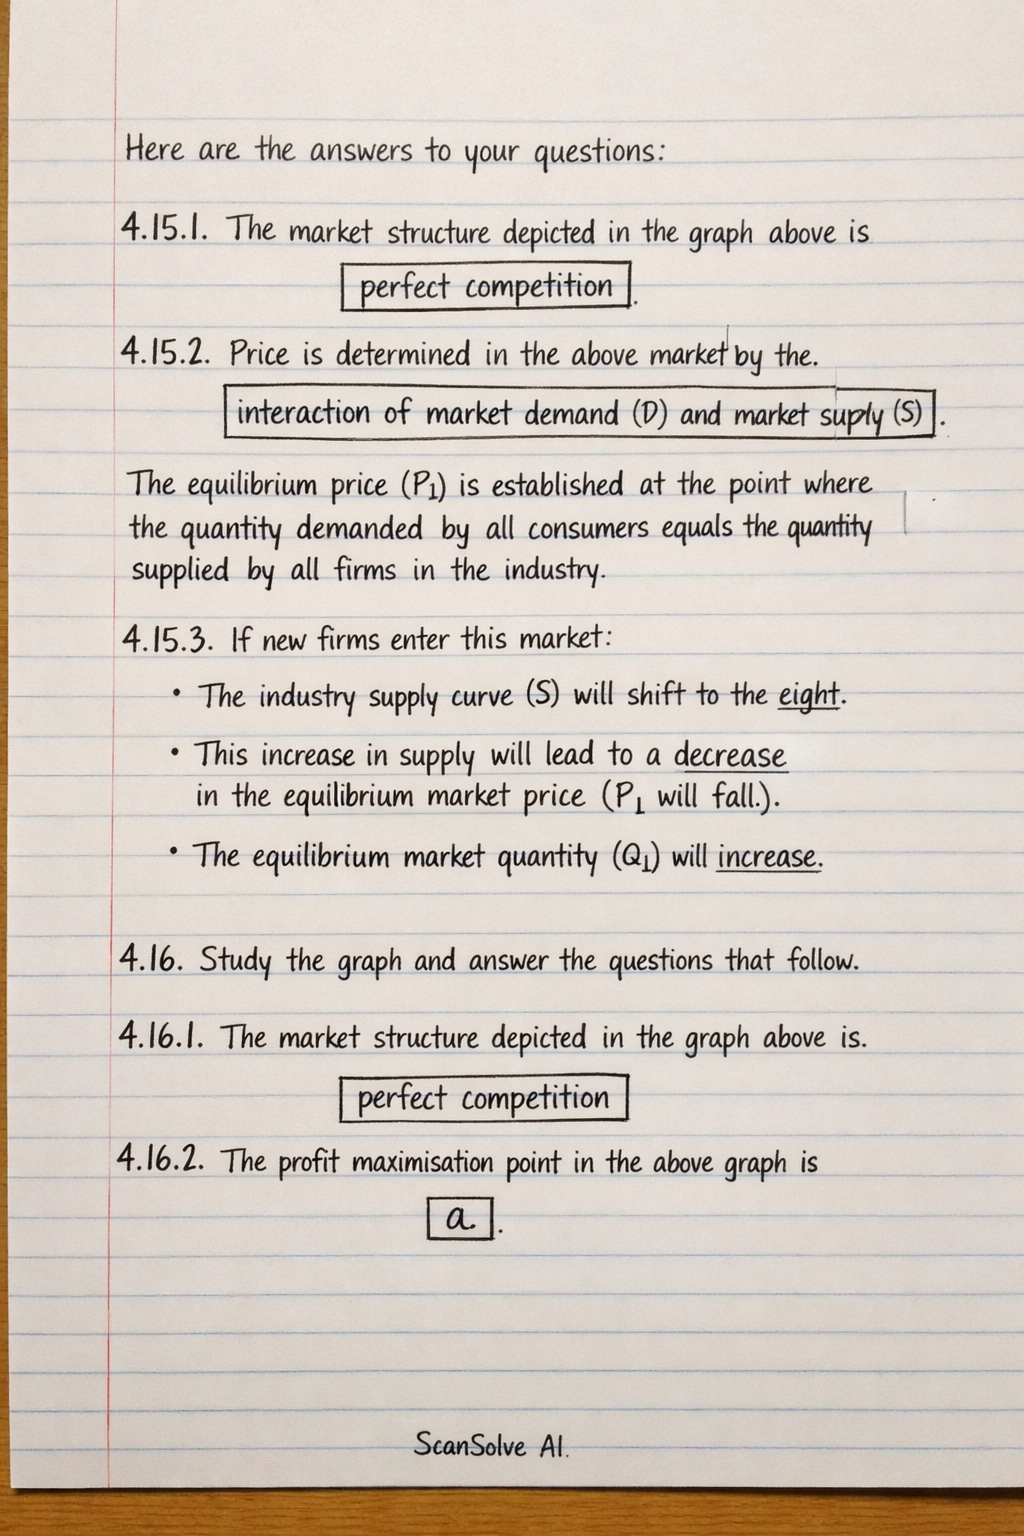
4.15.1. The market structure depicted in the graph above is .
4.15.2. Price is determined in the above market by the . The equilibrium price (P1) is established at the point where the quantity demanded by all consumers equals the quantity supplied by all firms in the industry.
4.15.3. If new firms enter this market:
- The industry supply curve (S) will shift to the right.
- This increase in supply will lead to a decrease in the equilibrium market price (P1 will fall).
- The equilibrium market quantity (Q1) will increase.
Part 4.16· 4 steps
Study the graph and answer the questions that follow.
4.16.1. The market structure depicted in the graph above is .
4.16.2. The profit maximisation point in the above graph is .
4.16.3. The demand curve in the graph (MR/AR/DD) is . It is a horizontal line at the market price, indicating that the individual firm can sell any quantity at the prevailing market price without affecting it.
4.16.4. One characteristic of a perfect competitor is that there are . This means no single buyer or seller has enough market power to influence the market price.
4.16.5. Calculate the profit/loss of the individual firm above. Show ALL calculations.
Identify Price (P), Average Cost (AC), and Quantity (Q) at profit maximization.
From the graph:
Calculate Total Revenue (TR).
Calculate Total Cost (TC).
Calculate Profit/Loss.
The individual firm is making an .
Still stuck on this one?
Ask a follow-up, and the answer starts from this question.
More Economics Questions
Handwritten Step-by-Step Solution
Get this as a handwritten image on WhatsApp — like a tutor wrote it for you.
Try on WhatsApp