
We read your photo as:
The diagram is called the production possibility curve. It is drawn under the assumptions: 1) The country can produce 2 goods guns and butter. 2) It uses all or its factors of production it uses land, capital, labour, entrepreneurship
Economics
ScanSolve AI Answer
Step-by-step solution
3 stepsIdentify the diagram.
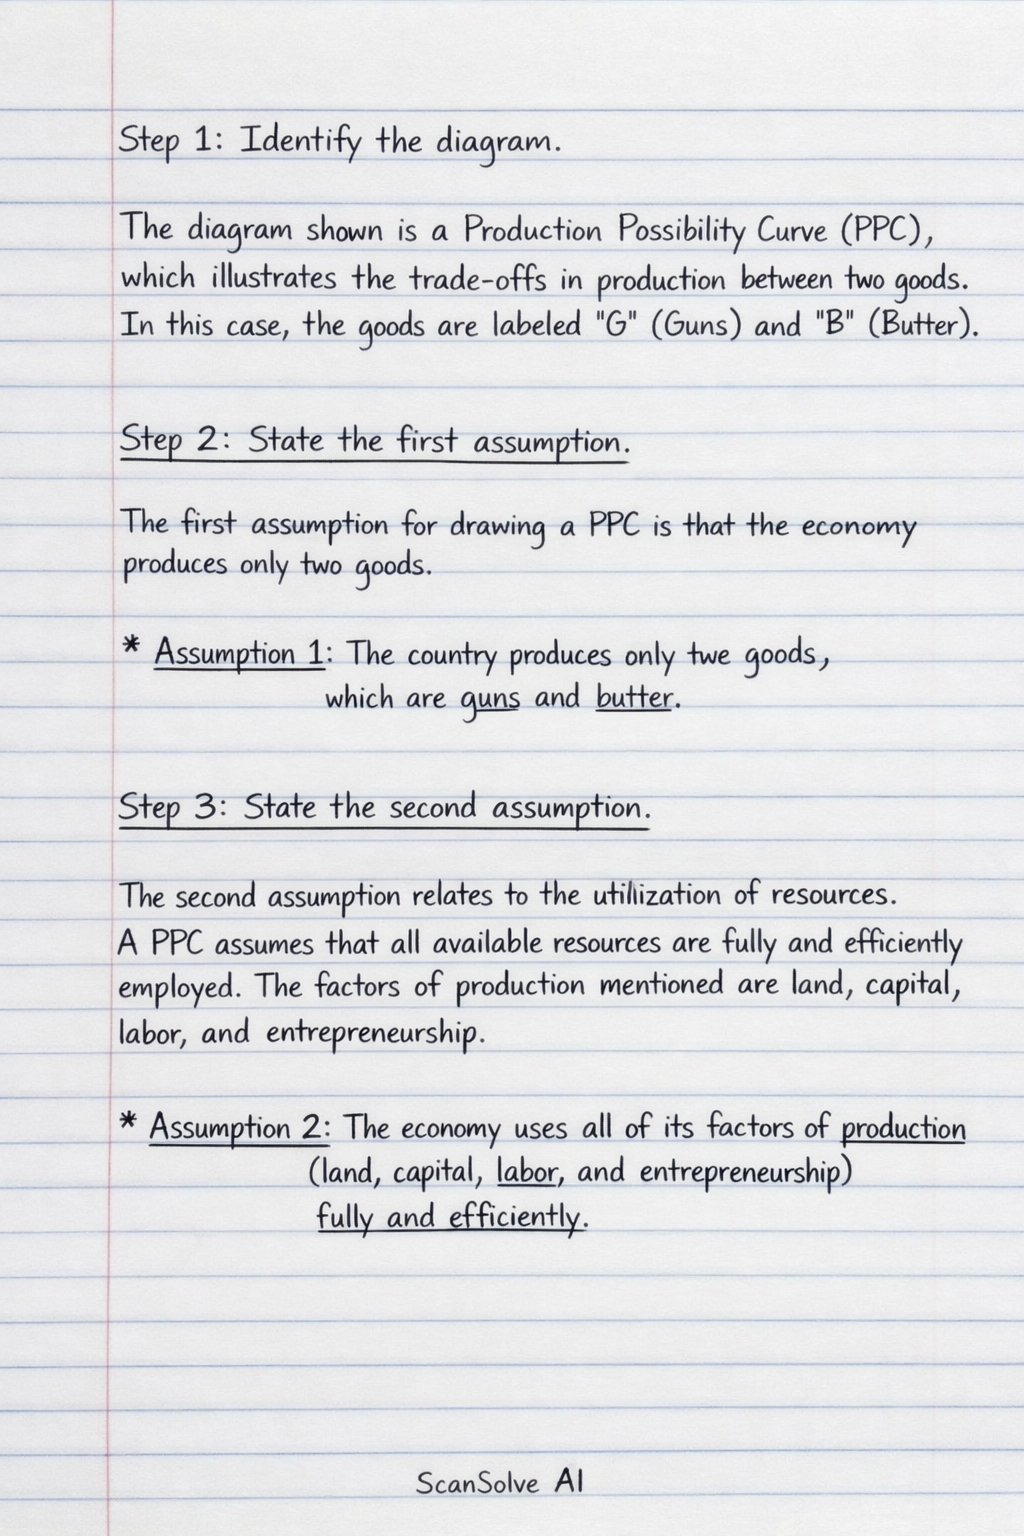
The diagram shown is a Production Possibility Curve (PPC), which illustrates the trade-offs in production between two goods. In this case, the goods are labeled 'G' (Guns) and 'B' (Butter).
State the first assumption.
The first assumption for drawing a PPC is that the economy produces only two goods.
- Assumption 1: The country produces only two goods, which are guns and butter.
State the second assumption.
The second assumption relates to the utilization of resources. A PPC assumes that all available resources are fully and efficiently employed. The factors of production mentioned are land, capital, labor, and entrepreneurship.
- Assumption 2: The economy uses all of its factors of production (land, capital, labor, and entrepreneurship) fully and efficiently.
Was this helpful?
Still stuck on this one?
Ask a follow-up, and the answer starts from this question.
Got a different question?Ask your own question
More Economics Questions
QRefer to the graph below that shows a production possibility curve with some possible production…QA) The Production Possibility Curve (PPC) is a graph that shows the various combinations of two…QDraw a Production Possibility Curve (PPC) for Rice and Corn given the following data points. Label…QA) With the aid of production possibility curves, distinguish between increasing and decreasing…QTo illustrate the concept of choice, we should first understand opportunity cost. This is defined as…
Handwritten Step-by-Step Solution
Get this as a handwritten image on WhatsApp — like a tutor wrote it for you.
Try on WhatsApp