
We read your photo as:
Assume that the government imposes a per unit tax on cigarettes of K2. Plot the new supply curve on your graph and label it S2.
ScanSolve AI Answer
Answers
2 partsStep-by-step solution
6 stepsHere are the answers to your questions based on the provided graph and the K2 tax:
Assumptions based on graph interpretation:
- The initial equilibrium quantity is 100 units.
- We assume each horizontal grid line on the price axis represents K1.
- Based on this, the initial equilibrium price is K3 (the third horizontal grid line from the bottom).
- The tax is K2 per unit.
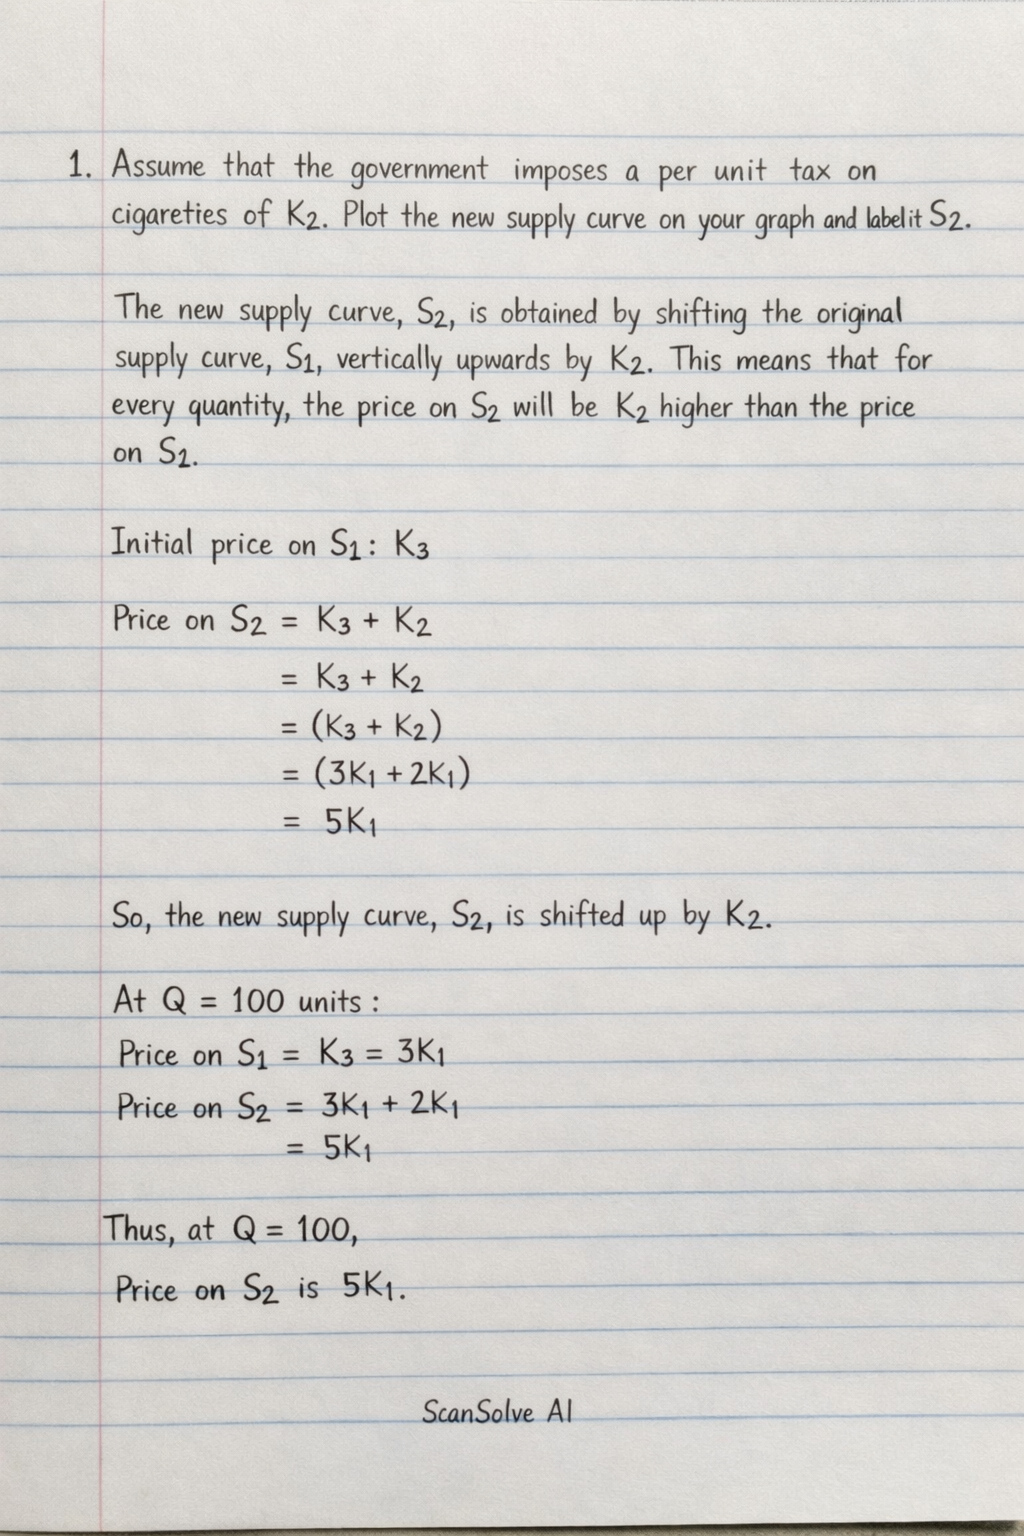
Assume that the government imposes a per unit tax on cigarettes of K2. Plot the new supply curve on your graph and label it S2.
The new supply curve, S2, is obtained by shifting the original supply curve, S1, vertically upwards by K2. This means that for every quantity, the price on S2 will be K2 higher than the price on S1. On your graph, you would draw a new line parallel to S1, but K2 higher at every point.
What is the equilibrium price after the tax is imposed?
After the K2 tax, the new equilibrium occurs where the demand curve intersects the new supply curve (S2). From the graph, this intersection point is at a quantity of 50 units. The price paid by consumers at this new equilibrium is at the fourth horizontal grid line.
Assuming each horizontal grid line represents K1, the new equilibrium price is .What is the price received by sellers after the tax is imposed?
The price received by sellers is the equilibrium price paid by consumers minus the tax.
Price received by sellers = K4 (equilibrium price) - K2 (tax) = .
This corresponds to the second horizontal grid line from the bottom on the graph.Shade the area representing the tax revenue on your graph.
The tax revenue is calculated as the tax per unit multiplied by the new equilibrium quantity.
New equilibrium quantity (from the graph) = 50 units.
Tax per unit = K2.
Tax revenue = K2 50 units = K100.
On your graph, this area is a rectangle. It is bounded by the new equilibrium quantity (50 units) on the x-axis, and the prices K2 (price received by sellers) and K4 (price paid by buyers) on the y-axis.If the demand for cigarettes is perfectly elastic, how will the burden of tax be distributed between buyers and sellers?
If the demand for cigarettes is perfectly elastic, consumers are extremely sensitive to price changes. This means that even a slight increase in price due to the tax would cause them to stop purchasing the product entirely. Therefore, sellers cannot pass any of the tax burden onto buyers. The entire burden of the tax will be borne by the sellers.
How much tax will be paid by;
Based on the graph and the K2 tax:
- Initial equilibrium price = K3.
- New equilibrium price (paid by buyers) = K4.
- Price received by sellers = K2.
- New equilibrium quantity = 50 units.
a) The sellers
The price received by sellers decreased from K3 (initial) to K2 (after tax), which is a decrease of K1 per unit.
Tax paid by sellers = K1/unit 50 units = .b) The buyers
The price paid by buyers increased from K3 (initial) to K4 (after tax), which is an increase of K1 per unit.
Tax paid by buyers = K1/unit 50 units = .
Try one yourself
A new problem that tests the same skill.
Still stuck on this one?
Ask a follow-up, and the answer starts from this question.
More Economics Questions
Handwritten Step-by-Step Solution
Get this as a handwritten image on WhatsApp — like a tutor wrote it for you.
Try on WhatsApp