
We read your photo as:
On the grid provided below, sketch the total revenue, marginal revenue and marginal cost curves. Hint: Output (Q) should be on the horizontal axis.
Economics
ScanSolve AI Answer
Step-by-step solution
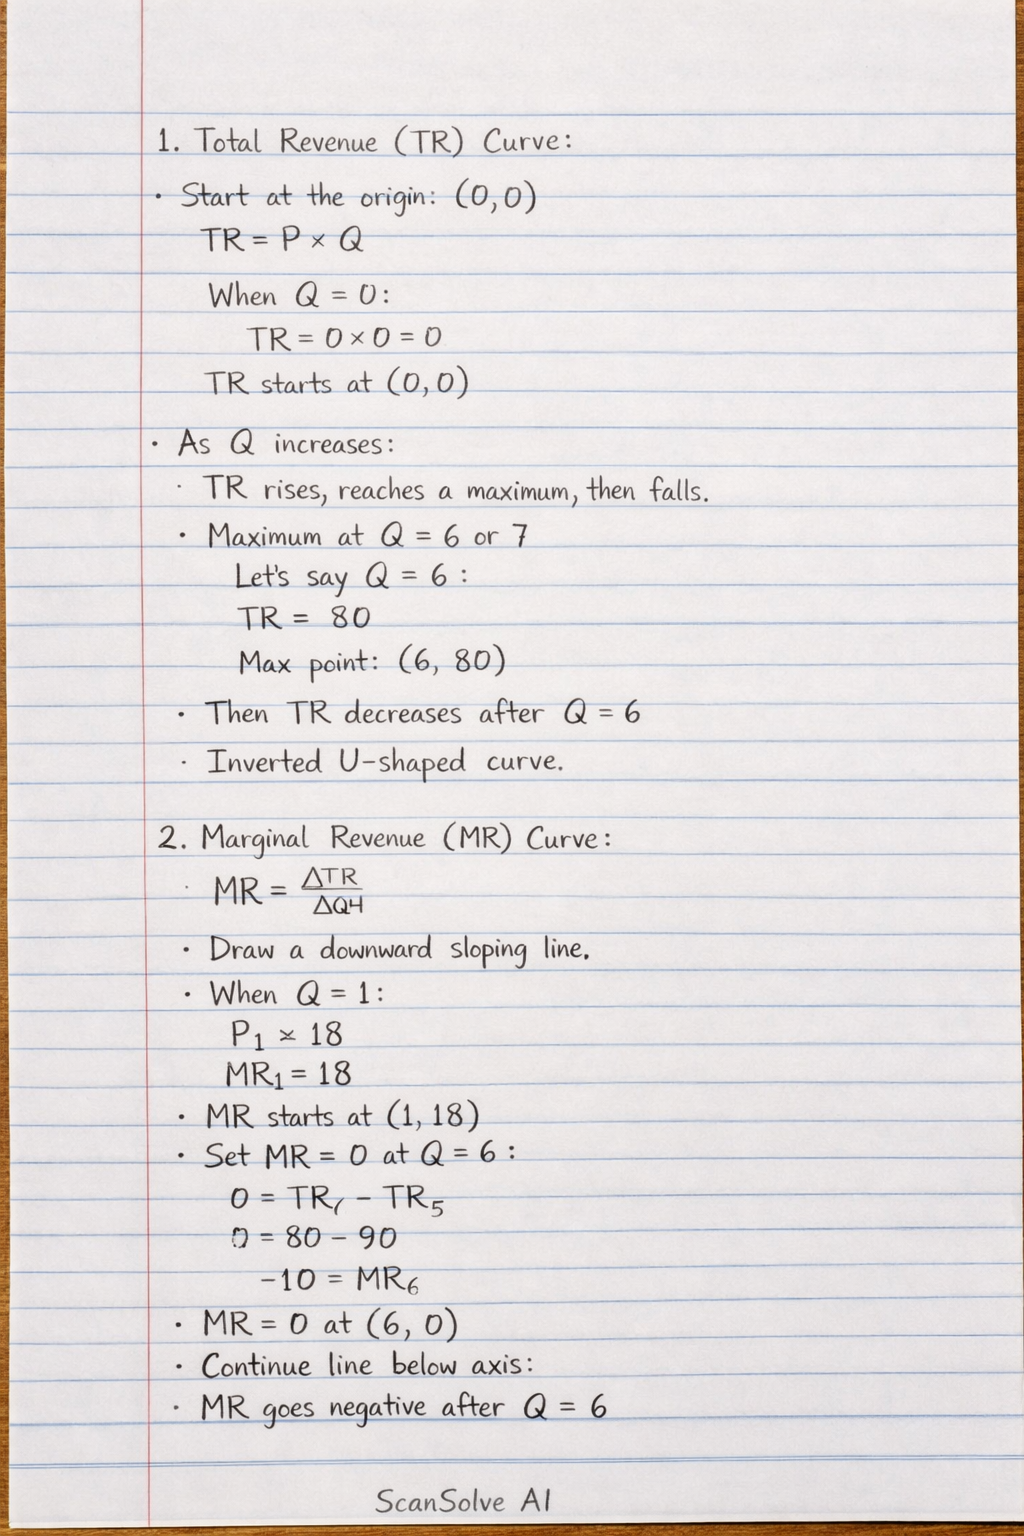
3 stepsTo sketch the total revenue, marginal revenue, and marginal cost curves on the provided grid:
Total Revenue (TR) Curve
- Start at the origin (0,0).
- Draw a curve that initially increases, reaches a maximum point (e.g., around Q=6 or 7, with TR around 80-90), and then begins to decrease. This curve typically has an inverted U-shape.
Marginal Revenue (MR) Curve
- Draw a downward-sloping line.
- It should start at a positive value on the vertical axis (e.g., around 15-20 for Q=1).
- The MR curve should intersect the horizontal axis (Output Q) at the same output level where the Total Revenue (TR) curve reaches its maximum.
- Continue the MR curve into the negative region after it crosses the horizontal axis.
Marginal Cost (MC) Curve
- Draw a U-shaped curve.
- It typically starts relatively high, decreases to a minimum point (e.g., around Q=3 or 4), and then rises sharply as output increases.
- The MC curve will generally intersect the MR curve at some point, which represents the profit-maximizing output level.
The exact numerical values for the curves are not given, so the sketch should focus on illustrating these characteristic shapes and their relationships on the grid.
Was this helpful?
Still stuck on this one?
Ask a follow-up, and the answer starts from this question.
Got a different question?Ask your own question
More Economics Questions
QSketch the Total Revenue (TR), Marginal Revenue (MR), and Marginal Cost (MC) curves using the…QPlease need from the above table to sketch the following, Tital Revenue Curve Marginal Rvenue Curve…QPlot the Total Revenue (TR) Curve.QGiven a table with Output (Q), Price (P), Total Cost (TC), and Marginal Cost (MC), calculate Total…QStudy the graph below and answer the questions that follow: Identify the market structure depicted…
Browse by topic:Microeconomics
Handwritten Step-by-Step Solution
Get this as a handwritten image on WhatsApp — like a tutor wrote it for you.
Try on WhatsApp