
We read your photo as:
This shows the variables that will determine how much of a good will be supplied.
ScanSolve AI Answer
Answer
Step-by-step solution
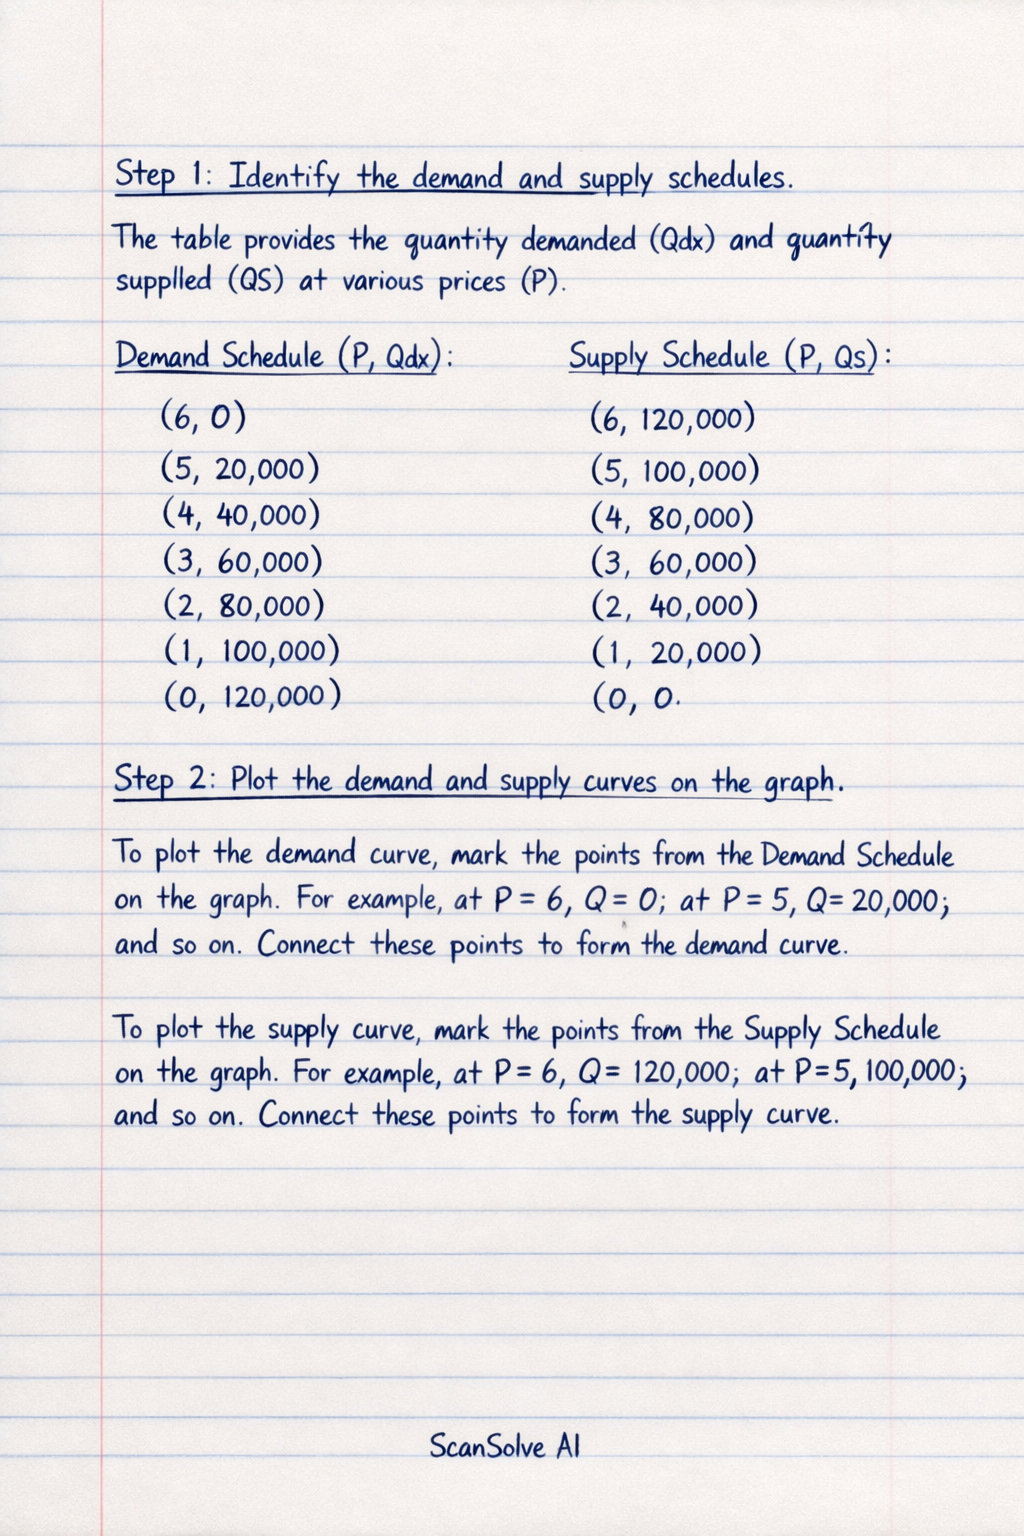
3 stepsIdentify the demand and supply schedules.
The table provides the quantity demanded (Qdx) and quantity supplied (QS) at various prices (P).
Demand Schedule (P, Qdx):
- $(6, 0)$
- $(5, 20,000)$
- $(4, 40,000)$
- $(3, 60,000)$
- $(2, 80,000)$
- $(1, 100,000)$
- $(0, 120,000)$
Supply Schedule (P, QS):
- $(6, 120,000)$
- $(5, 100,000)$
- $(4, 80,000)$
- $(3, 60,000)$
- $(2, 40,000)$
- $(1, 20,000)$
- $(0, 0)$
Plot the demand and supply curves on the graph.
To plot the demand curve, mark the points from the Demand Schedule on the graph. For example, at , ; at , ; and so on. Connect these points to form the demand curve.
To plot the supply curve, mark the points from the Supply Schedule on the graph. For example, at , ; at , ; and so on. Connect these points to form the supply curve.Determine the equilibrium price and quantity.
Equilibrium occurs where the quantity demanded equals the quantity supplied (). From the table, we look for the row where and are the same.
P Qdx QS 6 0 120,000 5 20,000 100,000 4 40,000 80,000 3 60,000 60,000 2 80,000 40,000 1 100,000 20,000 0 120,000 0 The equilibrium is found at where . This is also the point where the demand and supply curves would intersect on the graph.
The equilibrium price is and the equilibrium quantity is .
Try one yourself
A new problem that tests the same skill.
Still stuck on this one?
Ask a follow-up, and the answer starts from this question.
More Economics Questions
Handwritten Step-by-Step Solution
Get this as a handwritten image on WhatsApp — like a tutor wrote it for you.
Try on WhatsApp