
We read your photo as:
Jabu is a grade 11 learner who decided to save 150 every month so that he can buy a laptop. He started saving 150 in June 2021. He already had $600 in his piggy bank before starting this monthly plan.
ScanSolve AI Answer
Answer
\2400$
Step-by-step solution
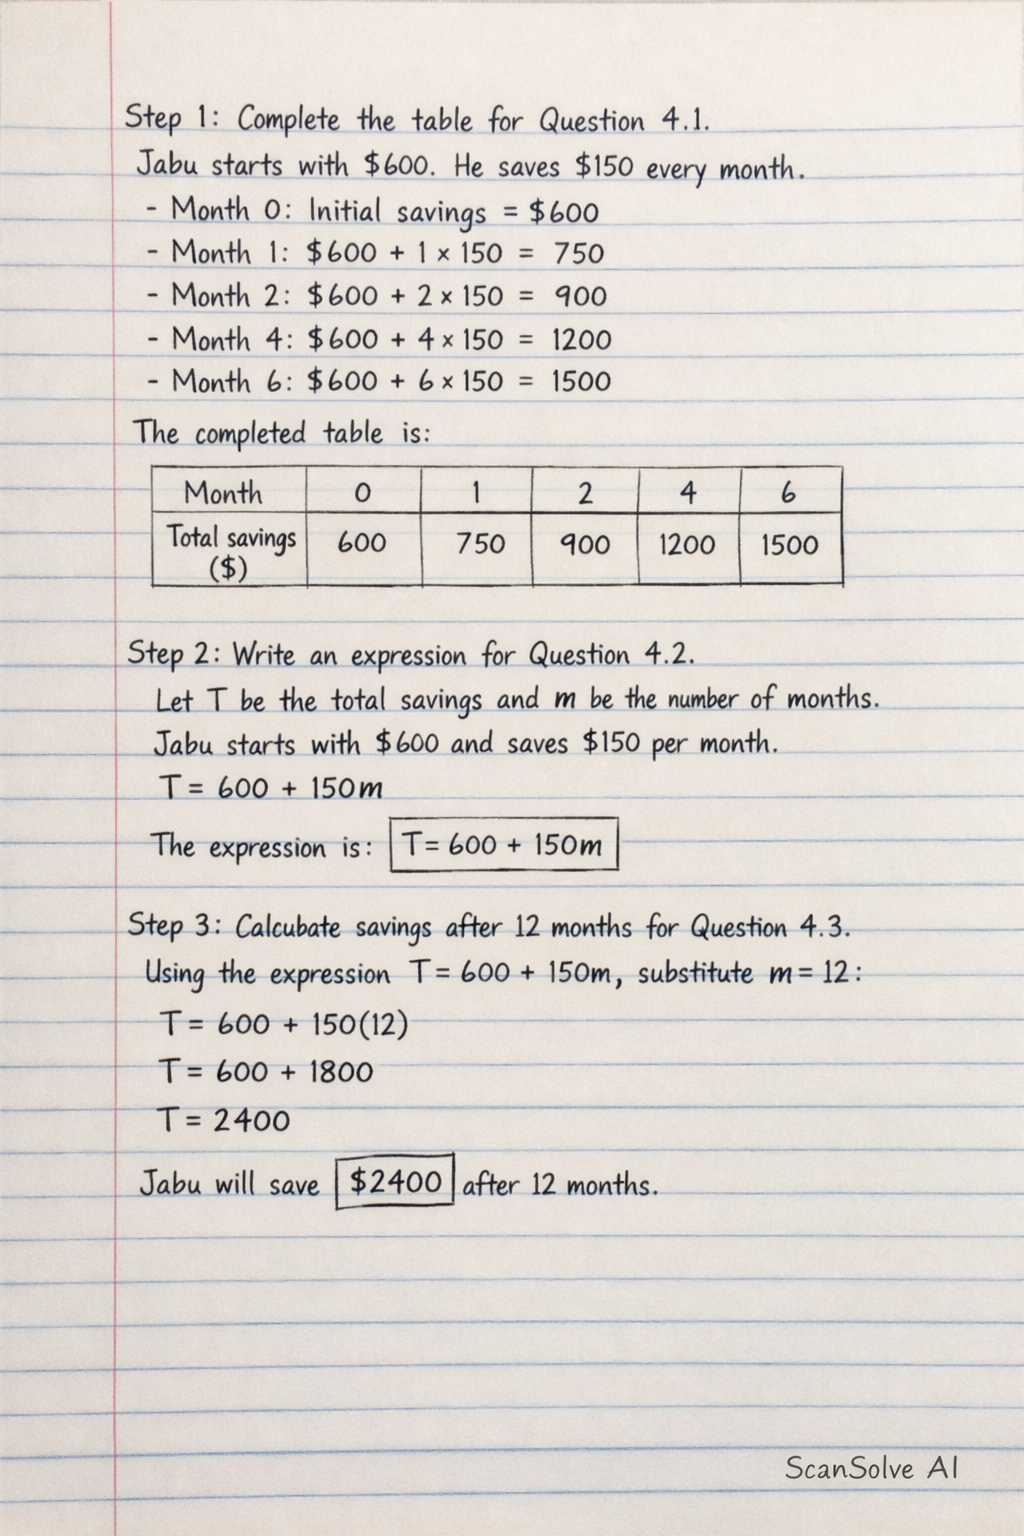
8 stepsComplete the table for Question 4.1.
Jabu starts with 150 every month.
- Month 0: Initial savings = $600
- Month 1: $600 + 1 \times 150 = 750
- Month 2: $600 + 2 \times 150 = 900
- Month 4: $600 + 4 \times 150 = 1200
- Month 6: $600 + 6 \times 150 = 1500
The completed table is:
Month 0 1 2 4 6 Total savings ($) 600 750 900 1200 1500 Write an expression for Question 4.2.
Let be the total savings and be the number of months.
Jabu starts with 150 per month.The expression is .
Calculate savings after 12 months for Question 4.3.
Using the expression , substitute :
Jabu will save
\boxed{\2400}$ after 12 months.Calculate the month and year Jabu can buy the laptop for Question 4.4.
The laptop costs T = 3500$ in the expression:
Since Jabu needs to have at least $3500, he must save for 20 full months. Let's check savings for 19 and 20 months:
- After 19 months: (Not enough)
- After 20 months: (Enough)
Jabu started saving in June 2021 (Month 0).
Counting 20 months from June 2021:- June 2021 (Month 0)
- June 2022 (Month 12)
- July 2022 (Month 13)
- August 2022 (Month 14)
- September 2022 (Month 15)
- October 2022 (Month 16)
- November 2022 (Month 17)
- December 2022 (Month 18)
- January 2023 (Month 19)
- February 2023 (Month 20)
Jabu will be able to buy the laptop in .
Complete the table for Question 5.1.
Mrs. Johns starts with 20 litres of paint. 1 litre of paint covers 10 m.
The paint remaining () is calculated as .- Area painted = 0 m: litres.
- Area painted = 20 m: litres.
- Area painted = 35 m: litres.
- Area painted = 50 m: litres.
- Area painted = 75 m: litres.
The completed table is:
Area painted (m) 0 20 35 50 75 Paint remaining in the tin (litres) 20 18 16.5 15 12.5 Describe the relationship for Question 5.2.
The relationship between the area painted and the amount of paint remaining in the tin is linear and inversely proportional. As the area painted increases, the amount of paint remaining decreases at a constant rate.
Describe how to draw a graph for Question 5.3.
To draw the graph, plot the points from the table: (0, 20), (20, 18), (35, 16.5), (50, 15), and (75, 12.5). The x-axis should be labelled "Area painted (m)" and the y-axis should be labelled "Paint remaining in the tin (litres)". The graph will be a straight line sloping downwards.
Give two reasons for painting walls for Question 5.4.
- Aesthetic improvement: Painting enhances the appearance of a room or building, allowing for changes in color and style.
- Protection: Paint provides a protective layer that shields walls from wear and tear, moisture, dirt, and minor damage.
Try one yourself
A new problem that tests the same skill.
Still stuck on this one?
Ask a follow-up, and the answer starts from this question.
More Mathematics Questions
Handwritten Step-by-Step Solution
Get this as a handwritten image on WhatsApp — like a tutor wrote it for you.
Try on WhatsApp