
We read your photo as:
This is electricity and MAGNETISM practical questions. Solve all systematically. Create the exact graph, the way it is supposed to be plot.
ScanSolve AI Answer
Answer
Step-by-step solution
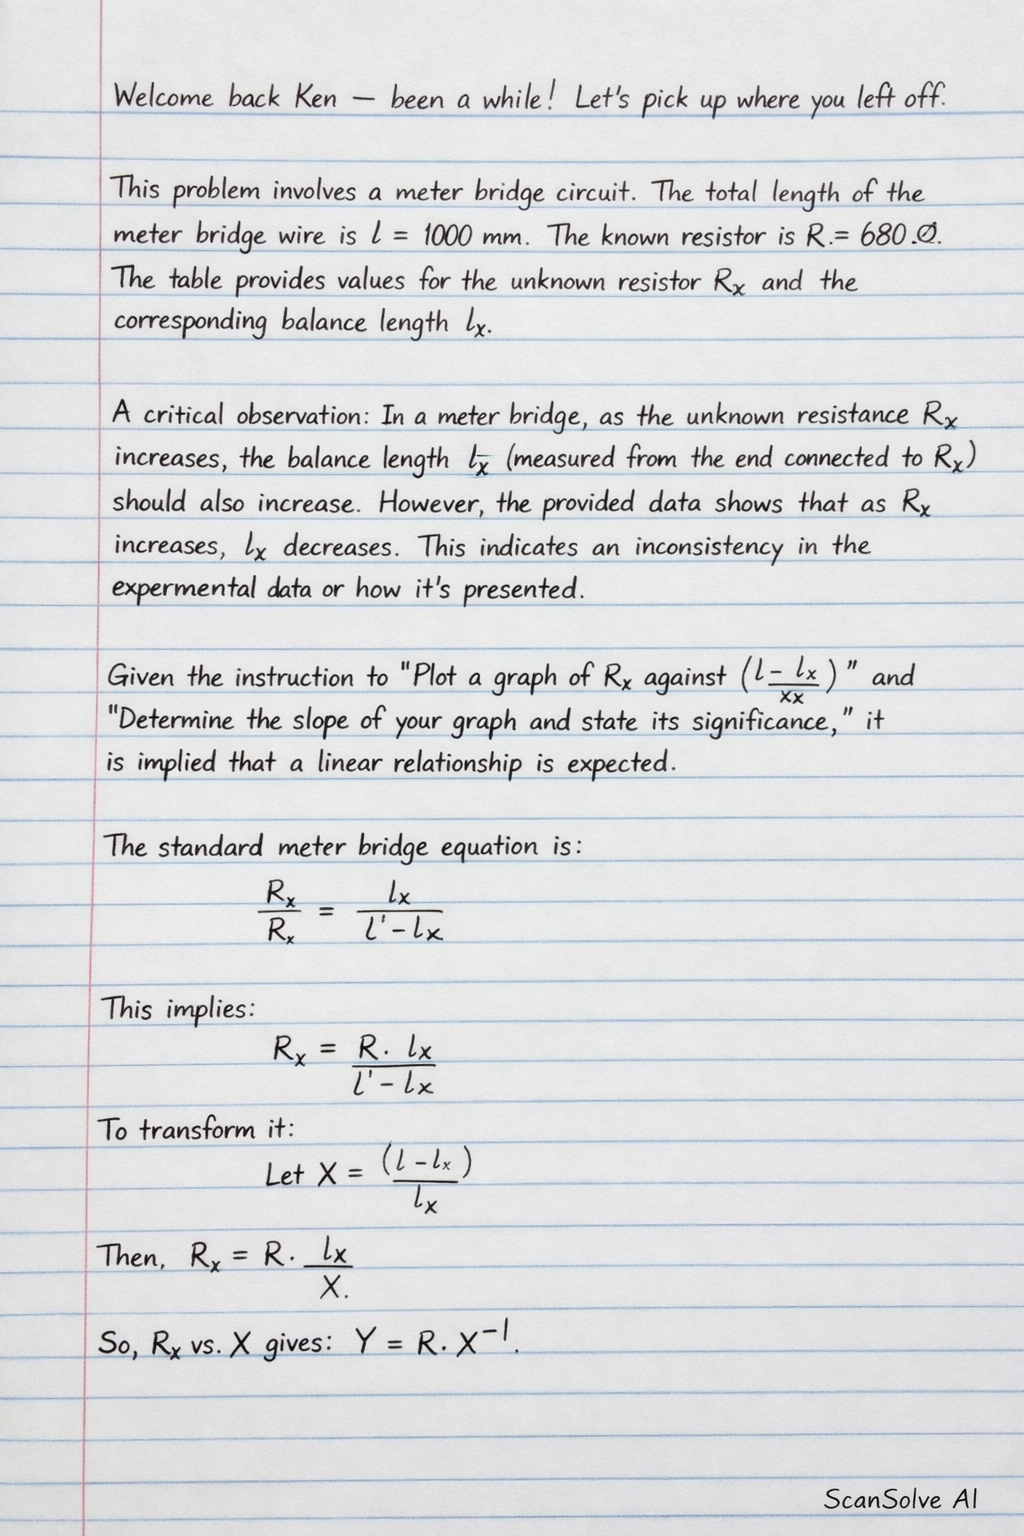
4 stepsThis problem involves a meter bridge circuit. The total length of the meter bridge wire is . The known resistor is . The table provides values for the unknown resistor and the corresponding balance length .
A critical observation: In a meter bridge, as the unknown resistance increases, the balance length (measured from the end connected to ) should also increase. However, the provided data shows that as increases, decreases. This indicates an inconsistency in the experimental data or how it's presented.
Given the instruction to "Plot a graph of against " and "Determine the slope of your graph and state its significance," it is implied that a linear relationship is expected. The standard meter bridge equation is , which implies . If we plot against , this would result in a curve ().
To obtain a linear graph as typically expected in such problems, we must assume the meter bridge equation is interpreted as , which rearranges to . Under this assumption, plotting (Y-axis) against (X-axis) would yield a straight line passing through the origin with a slope equal to . We will proceed with this assumption to fulfill the requirement of finding a slope.
Part a· 2 steps
Find . Tabulate your results.
Calculate for each value, where .
Calculate for each pair.
Convert from to .
Part b
Plot a graph of against .
To plot the graph:
- X-axis: (dimensionless). Scale: 0 to 1.4 (e.g., 10 small squares = 0.2 units).
- Y-axis: . Scale: 0 to 5000 (e.g., 10 small squares = 500 ).
- Plot the points:
- Draw the best-fit straight line through these points.
(Note: Due to the inconsistency in the provided data, the points may not fall perfectly on a straight line. A best-fit line should be drawn to represent the general trend.)
Part c
Determine the slope of your graph and state its significance.
Choose two points on the best-fit line (not necessarily data points) that are far apart to calculate the slope.
Let's pick two points from the calculated table that are roughly on the line.
Using points and :Calculate the slope.
The calculated slope is approximately . This value is significantly different from the given known resistance . This discrepancy arises from the inconsistency in the provided experimental data. However, following the assumption that , the slope of the graph represents the known resistance .
- Slope:
- Significance: The slope of the graph represents the value of the known resistor .
Part d
State two precautions you would have taken if you were to perform the experiment in a laboratory.
- Ensure all connections are tight to minimize contact resistance.
- Avoid overheating the wire by keeping the current on only when taking readings, to prevent changes in resistance.
- Use a sensitive galvanometer to accurately detect the null point.
- Repeat readings and take an average to reduce random errors.
- Ensure the meter rule is parallel to the wire to avoid parallax error in length measurements.
Part e
Explain how an ammeter is connected in an electric circuit.
An ammeter is always connected in series with the component through which the current is to be measured. It has a very low internal resistance to minimize its effect on the circuit's total resistance and thus on the current being measured.
Try one yourself
A new problem that tests the same skill.
Still stuck on this one?
Ask a follow-up, and the answer starts from this question.
More English Questions
Handwritten Step-by-Step Solution
Get this as a handwritten image on WhatsApp — like a tutor wrote it for you.
Try on WhatsApp