
We read your photo as:
4 Refer to the infographic below showing the Population System of South Africa in 2015.
ScanSolve AI Answer
Answer
Step-by-step solution
5 stepsThe image provided is very blurry, making it difficult to read the exact questions and precise values from the population pyramid. Based on common questions asked about population pyramids and the visible structure of the questions, I will infer the questions and provide answers. Please note that numerical values are estimates due to the image quality.
1.4.1 Identify the age group with the highest population in South Africa.
Visually inspect the population pyramid to find the widest bars, which represent the largest population groups.
Observe the age range corresponding to these widest bars.
Based on the visual, the age group with the highest population appears to be 25-29 years old.
1.4.2 Calculate the percentage of the population that is 65 years and older.
Estimate the percentage of males and females for each age group from 65-69 upwards from the pyramid.
Sum these estimated percentages.
- 65-69 years: Approximately 1.5% (Male) + 1.8% (Female) = 3.3%
- 70-74 years: Approximately 1.0% (Male) + 1.2% (Female) = 2.2%
- 75-79 years: Approximately 0.6% (Male) + 0.8% (Female) = 1.4%
- 80-84 years: Approximately 0.3% (Male) + 0.4% (Female) = 0.7%
- 85+ years: Approximately 0.2% (Male) + 0.3% (Female) = 0.5%
Calculate the total percentage.
The estimated percentage of the population that is 65 years and older is approximately .
1.4.3 Comment on the shape of the population pyramid and what it suggests about South Africa's population.
The population pyramid for South Africa in 2023 generally has a broad base, indicating a relatively high birth rate, though it may be narrowing compared to past decades. It then tapers significantly towards the top, showing a smaller proportion of elderly people. There is also a noticeable narrowing in the middle age groups (e.g., 30s-40s), which could suggest the impact of factors like the HIV/AIDS epidemic in previous decades or emigration. This shape suggests a relatively young population with a significant working-age group, but also highlights past demographic challenges.1.4.4 Suggest TWO challenges associated with a large young dependent population.
- Strain on education and healthcare systems: A large number of young people requires substantial investment in schools, teachers, and child-specific healthcare services.
- Future unemployment: If the economy does not grow sufficiently to create enough jobs for the large youth cohort as they enter the workforce, it can lead to high unemployment rates and social instability.
1.4.5 Suggest TWO challenges associated with a large elderly dependent population.
- Increased demand for healthcare and social services: An aging population requires more specialized medical care, long-term care facilities, and social support programs, placing a burden on public finances.
- Pressure on pension and social security systems: With fewer working-age people supporting a growing number of retirees, pension funds and social security systems can face financial strain, potentially leading to reduced benefits or increased taxes.
Try one yourself
A new problem that tests the same skill.
Still stuck on this one?
Ask a follow-up, and the answer starts from this question.
More Geography Questions
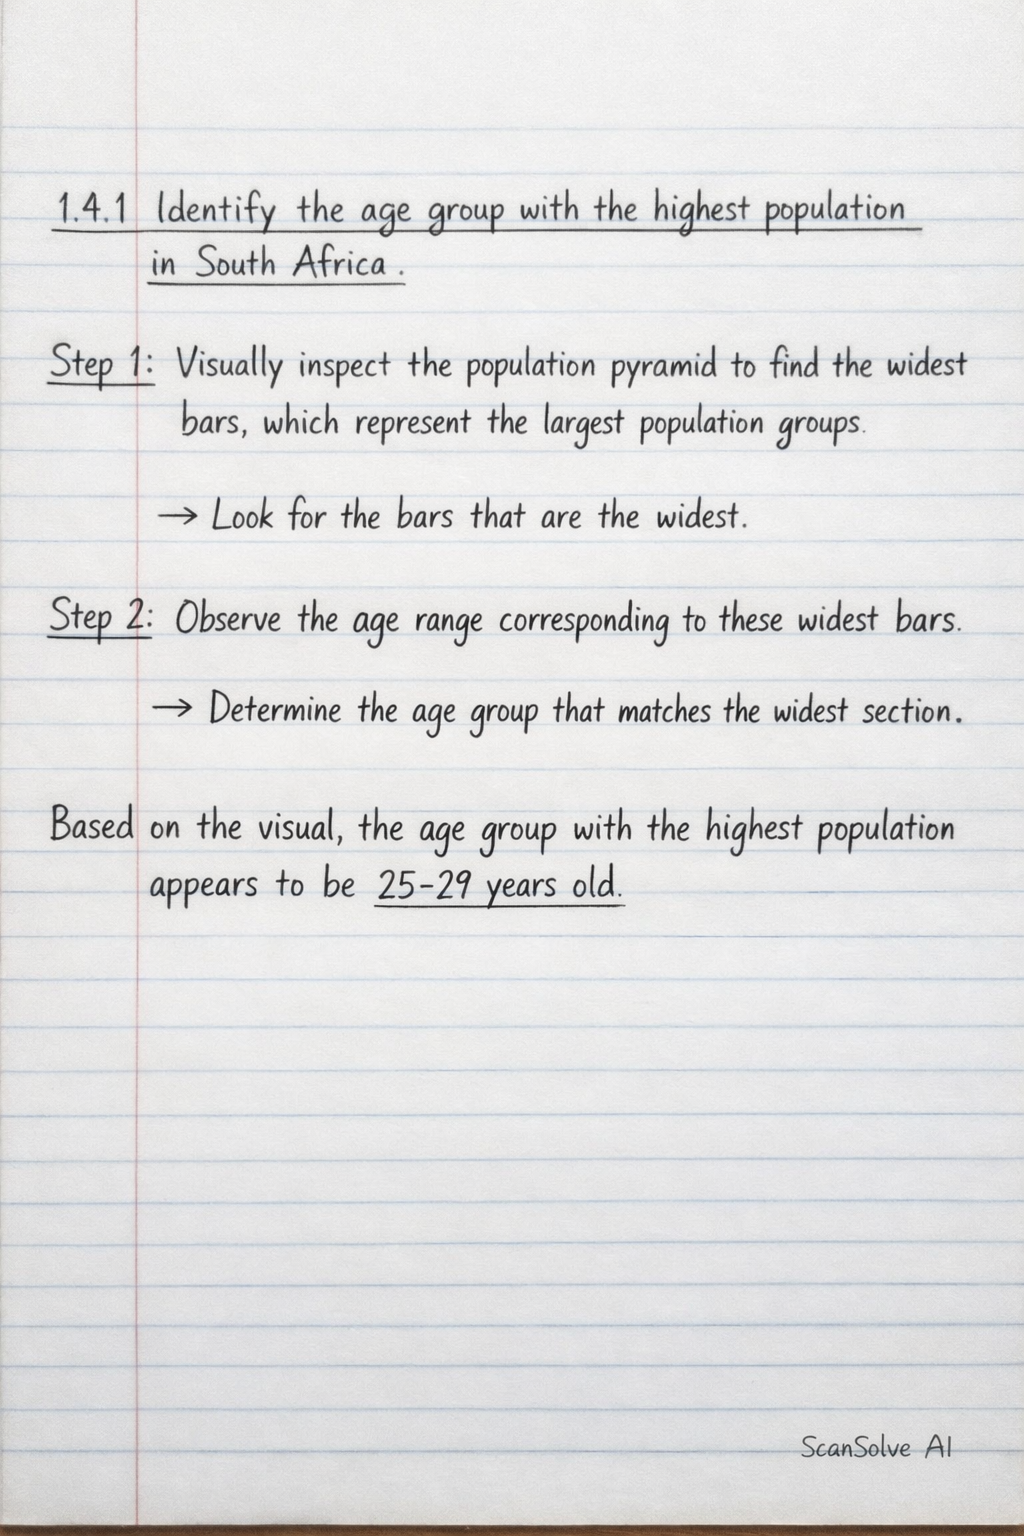
Handwritten Step-by-Step Solution
Get this as a handwritten image on WhatsApp — like a tutor wrote it for you.
Try on WhatsApp