
We read your photo as:
How do I construct a climograph for City Y, given its temperature and precipitation data?
ScanSolve AI Answer
Step-by-step solution
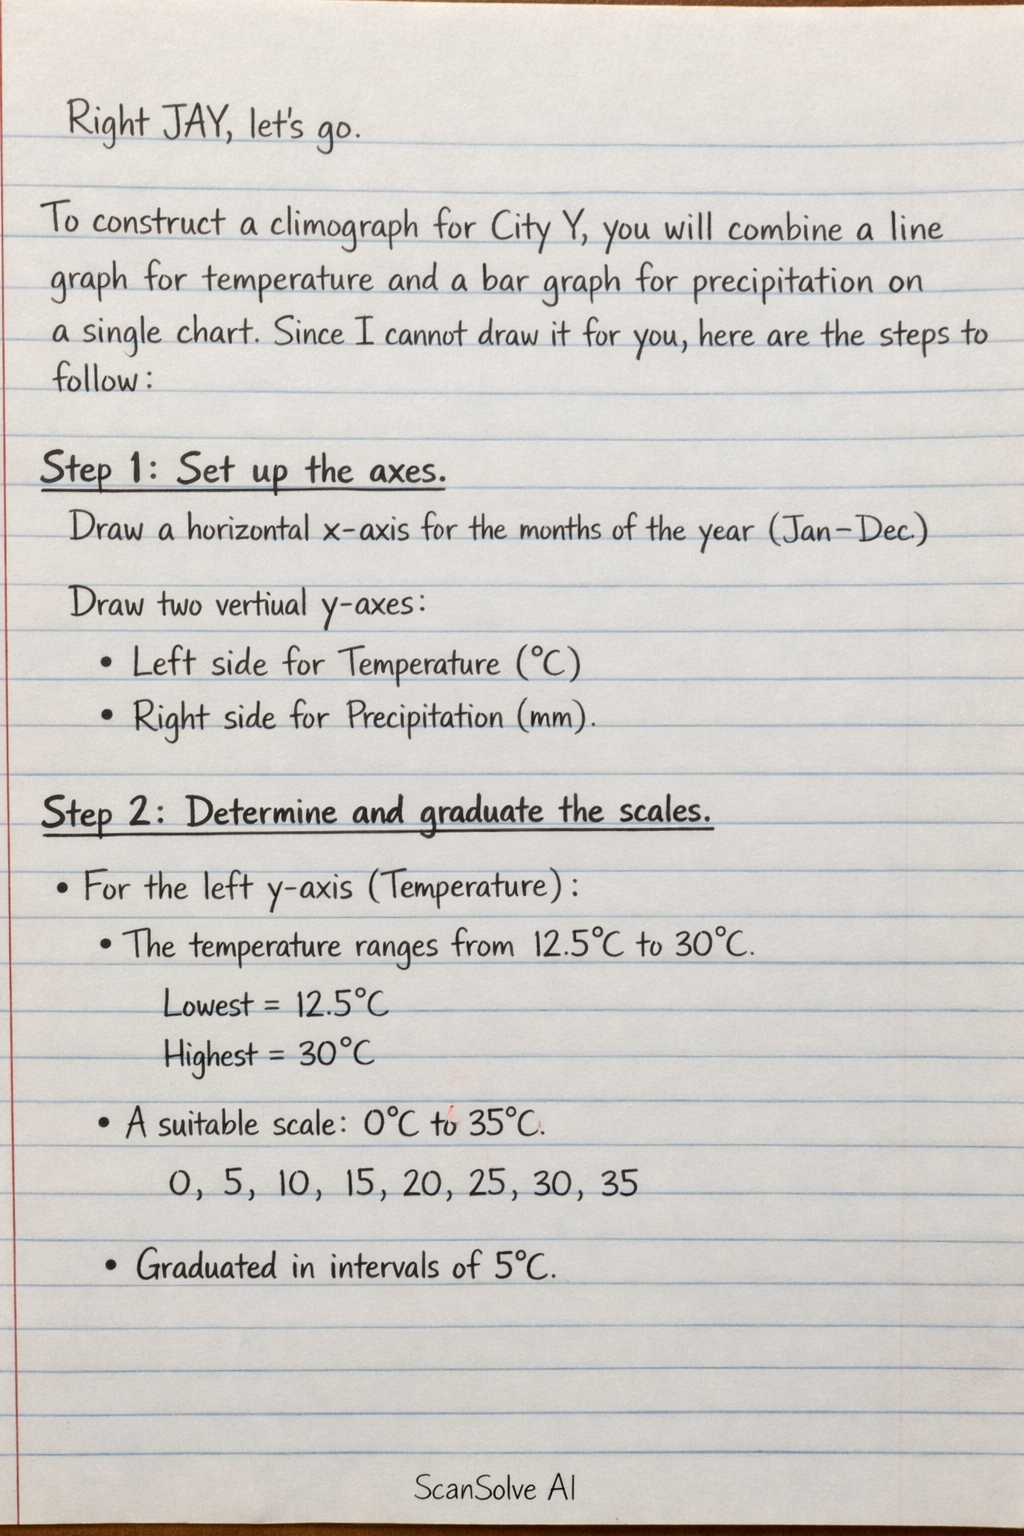
5 stepsTo construct a climograph for City Y, you will combine a line graph for temperature and a bar graph for precipitation on a single chart. Since I cannot draw it for you, here are the steps to follow:
Set up the axes*.
Draw a horizontal x-axis for the months of the year (January to December). Draw two vertical y-axes: one on the left for temperature (°C) and one on the right for precipitation (mm).
Determine and graduate the scales*.
- For the left y-axis (Temperature): The temperature ranges from to . A suitable scale would be from to or , graduated in equal intervals (e.g., every ).
- For the right y-axis (Precipitation): The precipitation ranges from to . A suitable scale would be from to or , graduated in equal intervals (e.g., every ). Ensure the precipitation scale is roughly double the temperature scale if possible, as is common practice (e.g., corresponds to ).
Plot the temperature data*.
For each month, plot a point corresponding to its temperature value on the graph using the left y-axis. Once all points are plotted, connect them with a smooth line to form the temperature curve.
Plot the precipitation data*.
For each month, draw a bar (column) representing its precipitation value, using the right y-axis. The bars should be centered over each month on the x-axis.
Add labels and title*.
- Label the x-axis "Months".
- Label the left y-axis "Temperature ()" and the right y-axis "Precipitation (mm)".
- Add a clear title to the climograph, such as "Climograph for City Y".
The completed climograph will visually represent the climate patterns of City Y throughout the year.
Still stuck on this one?
Ask a follow-up, and the answer starts from this question.
More Geography Questions
Handwritten Step-by-Step Solution
Get this as a handwritten image on WhatsApp — like a tutor wrote it for you.
Try on WhatsApp