
We read your photo as:
Suppose you have population data for different administrative districts. Which mapping technique would you use to visualize the data, and why? Explain the characteristics and potential advantages of your choice.
Geography
ScanSolve AI Answer
Answer
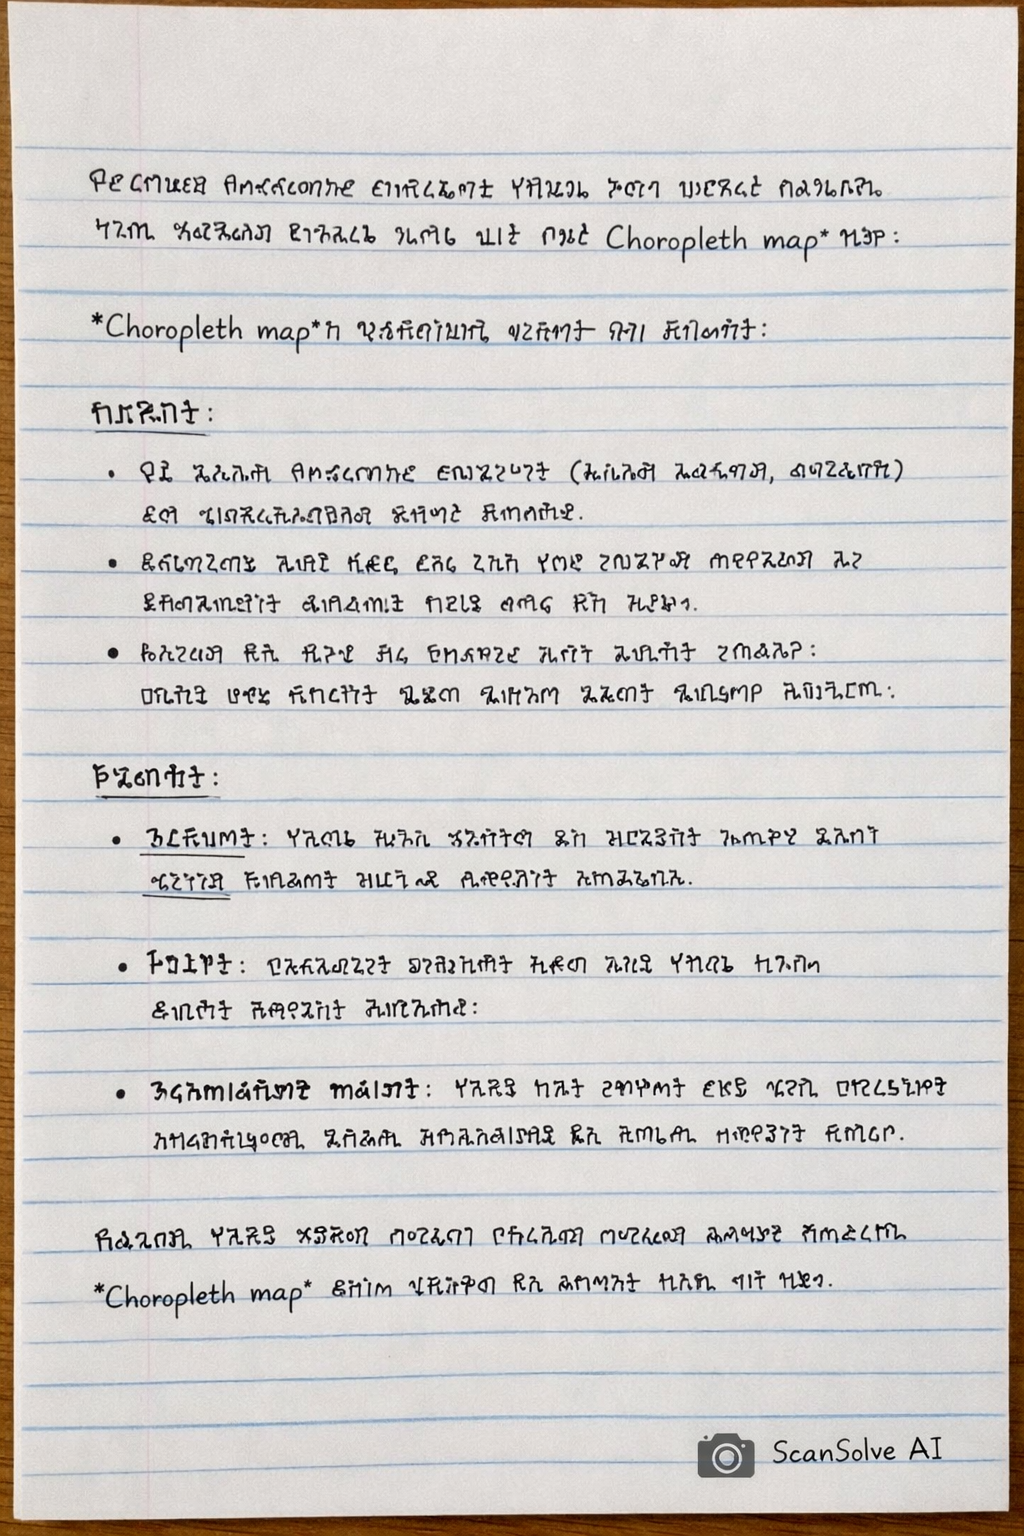
የተለያዩ የአስተዳደር ወረዳዎች የህዝብ ብዛት መረጃን ለማሳየት በጣም ተስማሚው የማሳያ ዘዴ Choropleth map ነው።
Choropleth map ን የመረጥኩበት ምክንያት እና ጥቅሞቹ:
-
ባህሪያት:
- ይህ ካርታ የአስተዳደር ወረዳዎችን (ለምሳሌ ክልሎች፣ ወረዳዎች) እንደ ጂኦግራፊያዊ ክፍሎች ይጠቀማል።
- እያንዳንዱ ክፍል እንደ ህዝብ ብዛት ባሉ የቁጥር መረጃዎች ላይ በመመስረት በተለያየ ቀለም ወይም ጥላ ይሞላል።
- ብዙውን ጊዜ ቀለል ያሉ ቀለሞች ዝቅተኛ እሴቶችን ሲያሳዩ፣ ጠቆር ያሉ ቀለሞች ደግሞ ከፍተኛ እሴቶችን ያመለክታሉ።
-
ጥቅሞች:
- ግልጽነት: የህዝብ ብዛት ስርጭትን እና ጥግግትን በአንድ እይታ በቀላሉ ለመረዳት ያስችላል።
- ንጽጽር: በተለያዩ ወረዳዎች መካከል ያለውን የህዝብ ብዛት ልዩነት በቀላሉ ማወዳደር ይቻላል።
- አዝማሚያዎችን ማሳየት: የህዝብ ብዛት ከፍተኛ ወይም ዝቅተኛ የሆኑባቸውን አካባቢዎች በመለየት አዝማሚያዎችን እና ቅጦችን ለመለየት ይረዳል።
በአጭሩ፣ የህዝብ ብዛት መረጃን በአስተዳደር ወረዳዎች ለማሳየት Choropleth map በጣም ውጤታማ እና ለመረዳት ቀላል ዘዴ ነው።
Was this helpful?
Still stuck on this one?
Ask a follow-up, and the answer starts from this question.
Got a different question?Ask your own question
More Geography Questions
QDraw a map of your community and explain special features?QLand-use: Draw or get a map of the area. Use a map and shade different areas with different colours…QWhat type of charts are suitable for displaying the distribution of gender, township, weight, and…QMapping in a Geography research task involves creating a map or maps that visually represent the…QUsing the provided data, suggest an appropriate statistical method to represent the affected…
Handwritten Step-by-Step Solution
Get this as a handwritten image on WhatsApp — like a tutor wrote it for you.
Try on WhatsApp